2. 中国海洋大学物理海洋教育部重点实验室,山东 青岛 266100;
3. 连云港市气象局,江苏 连云港 222006
2. Key Laboratory of Physical Oceanography (Ocean University of China), Ministry of Education, Qingdao 266100, China;
3. Lianyungang Meteorological Bureau, Lianyungang 222006, China
东海是我国经济、社会、军事等各方面活动频繁的海域。春季冷暖空气交换频繁,易出现对流性天气[1]。海上大风、强降水等对流性天气会影响海上社会经济活动,研究其形成机理可以为进一步提高海上强天气预报服务提供理论支持。
东海作为我国和西太平洋的边缘海,其西北侧具有宽广的大陆架,东南侧为冲绳海槽,兼有浅海和深海的特征[2]。流经东海的黑潮,在冬春季可与北侧的陆架冷水之间形成强的海表面温度梯度,即东海黑潮锋[2-3]。研究[4-7]表明,东海黑潮锋可调节区域气候和低云。XU et al.[8]研究发现东海黑潮上存在表层风辐合和降水带,其中对流性降水比层状云降水对海洋锋更为敏感。类似的区域气候效应在湾流和黑潮延伸体等处均有表现[9-11]。此外LIU et al.[12]分析低云对东海黑潮锋的响应,发现春季暖水侧有突破海洋大气边界层(marine atmospheric boundary layer, MABL)的深厚云。
天气尺度上,有学者[13-15]探究了MABL垂直结构和低云对东海黑潮海表面温度锋(黑潮锋)的响应,以及跨海洋锋变化。如海洋锋引起的次级环流导致暖水侧MABL加深,云底升高,冷水侧出现相反的现象[16-17]。杨爽等[18]选取了不同季节低云响应的个例,发现春季边界层稳定时低压前部出现层云,向北云顶高度降低。JIANG et al.[19]在海洋涡旋区域发现来自暖水上空的水汽在风辐合作用下,强迫局地对流云发展。以上这些研究主要集中于MABL内云的响应,对于突破MABL发展到自由大气的深厚对流云形成机理尚少有研究,而后者也是东海黑潮锋影响自由大气乃至大气环流异常的重要途径[20-21]。
目前常用来解释东海黑潮锋影响大气的物理机制有垂直混合机制和气压调整机制。垂直混合机制中,暖海面上空大气不稳定,垂直混合强,上层高的动量传递到海表面,导致表层风速增强[22-23]。在气压调整机制中,假设MABL的热力结构直接受海面温度(sea surface temperature, SST)控制,暖海面使得边界层空气增暖,海平面气压降低,反之冷海面使空气变冷,气压升高,因此气压梯度出现在海洋锋区上空,海洋锋两侧的气压异常可能导致次级环流[24]。
春季东海黑潮锋强度强盛,大气冷暖气团活动频繁。本文针对2018年4月30日黑潮锋附近一次对流云团发展和强降水天气,利用卫星观测和再分析数据等资料,分析天气尺度扰动和黑潮锋强迫对强降水天气发展的贡献。本研究有助于分析天气尺度扰动下黑潮锋强迫低云发展至自由大气的机理,也可为分析全球变暖背景下强降水发生概率增加的原因提供参考。
1 资料和方法本文所用的降水资料来自于GPM卫星的三级产品IMERG Final Precipitation (https://doi.org/10.5067/GPM/IMERG/3B-HH/06),经过全球雨量站点进行校正,空间分辨率为0.1°,时间分辨率为0.5 h。云水路径和云微物理参数来自于MODIS的二级产品MYD06 (http://dx.doi.org/10.5067/MODIS/MYD06_L2.061),空间分辨率为1 km。使用欧洲中期天气预报中心(European Centre for Medium-Range Weather Forecasts, ECMWF)提供的全球大气再分析资料EAR5 (https://doi.org/10.24381/cds.bd0915c6, https://doi.org/10.24381/cds.adbb2d47),水平分辨率为0.25°,时间间隔为1 h,200 hPa以下共23层。若无特别说明,文中所使用的SST均来自于美国国家海洋与大气管理局(National Oceanic and Atmospheric Administration, NOAA)提供的逐日最佳插值海面温度(Optimum Interpolation Sea Surface Temperature, OISST)(https://www.ncei.noaa.gov/data/sea-surface-temperature-optimum-interpolation/v2.1/access/avhrr/),空间分辨率为0.25°[25]。
文中利用下方公式诊断分析水汽条件:
| $ \frac{1}{g}\nabla \cdot \left( {q\;\boldsymbol{\vec v}} \right) = \frac{1}{g}\boldsymbol{\vec v} \cdot \nabla q + \frac{q}{g}\nabla \cdot \boldsymbol{\vec v} $ | (1) |
其中g为重力加速度,单位为m·s-2;q为比湿,单位为g·kg-1;
利用潜热函数F计算潜热释放H,两者计算方式如下:
| $ H=-L \frac{\mathrm{d} q_{\mathrm{s}}}{\mathrm{d} t}=-L F \omega $ | (2) |
| $ F=\frac{q_{\mathrm{s}} T}{p}\left(\frac{L R-c_{p} R_{\mathrm{w}} T}{c_{p} R_{\mathrm{w}} T^{2}+q_{\mathrm{s}} L^{2}}\right) $ | (3) |
其中L为凝结潜热,取常数值为2.5×10⁶ J·kg-1;R为干空气的气体常数,值为287 m2·s-2·K-1;cp为标准状态下的空气定压比热容,值为1 000 J·kg-1·K-1;Rw为水汽的气体常数,值为460 m2·s-2·K-1[26]。qs为饱和比湿,单位为kg·kg-1;T为气温,单位为K;p为气压,单位为Pa;F的单位为Pa-1,ω为p坐标中的垂直速度,单位为Pa·s-1。
采用Tetens经验公式计算饱和水汽压
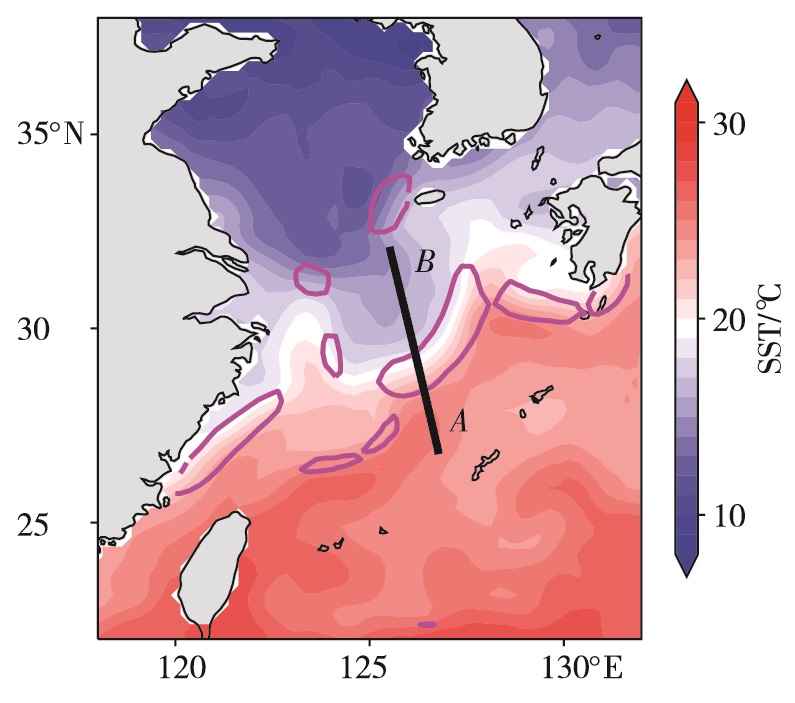
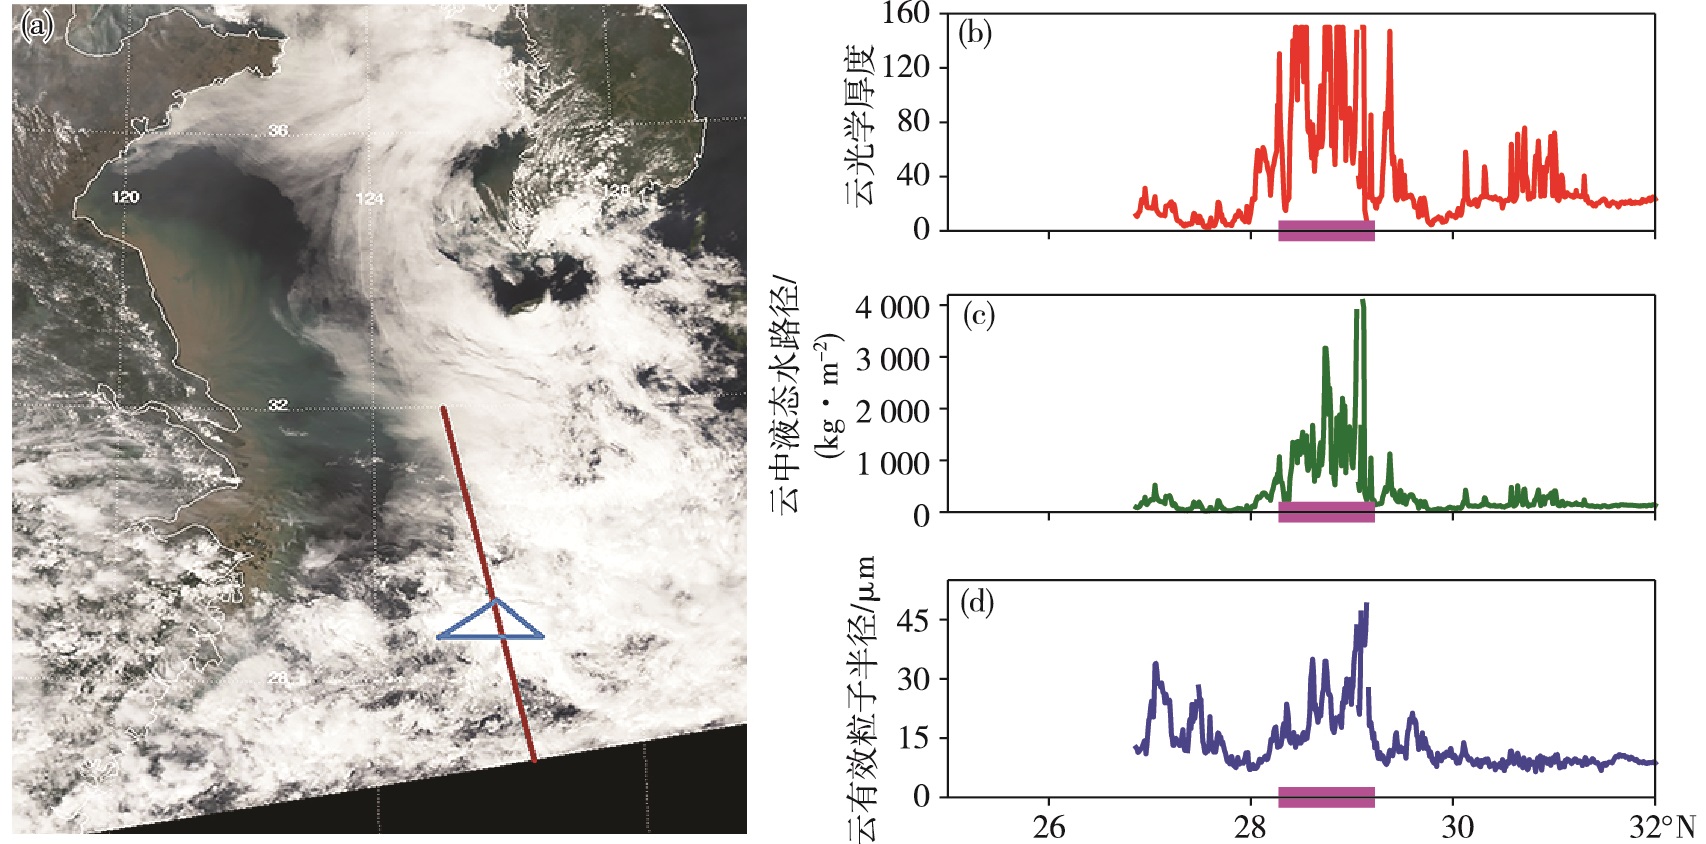
本文将SST梯度大于4×10⁻² ℃·km-1的区域定为海洋锋所在位置(图 1),图 1品红色实线所围的最大区域为东海黑潮锋。线AB上位于黑潮锋区域的部分即图 2b横坐标轴上的紫线位置,其纬度在28.375°~29.125°N,经度在126°E左右。由MODIS可见光云图(图 2a)可知,2018年4月30日05时(UTC,下同)黑潮锋上方云团呈亮白色且有暗影,说明此处的云高于周围的云[27],相当黑体亮温(black-body temperature, TBB)低于-32 ℃(图略)。根据MYD06云产品,05时在黑潮锋南北两侧,云光学厚度等量值较小,变化比较平稳;在黑潮锋附近出现突变,量值明显增大,振幅增大:云团的云光学厚度介于80~160(图 2b);云水路径在1 kg·m-2左右,最大达4 kg·m-2(图 2c);云中有效粒子半径大于15 μm,最大达45 μm(图 2d),而层云有效半径一般小于10 μm[28]。综合上述特征,可以看出此云团为深厚的对流云团。
|
图 1 2018年4月30日SST(色阶,单位:℃)的空间分布(品红色实线区域内SST梯度≥4×10⁻² ℃·km-1,黑线AB为沿黑潮锋的剖面) Fig.1 SST field (color scale, units: ℃) on 30 April 2018 (area inside magenta solid line for SST gradient greater than or equal to 4×10⁻² ℃·km-1, line AB for profile along the Kuroshio front) |
|
图 2 2018年4月30日05时MODIS可见光云图(a,红色实线同图 1中AB,蓝色三角形表示黑潮锋上云团位置)、沿图 1中AB云光学厚度(b,红色实线)的分布(横坐标轴上品红色实线为黑潮锋的位置,下同)、云中液态水路径(c,绿色实线,单位:kg·m-2)以及云有效粒子半径(d,蓝色实线,单位:μm) Fig.2 MODIS visible cloud imagery (a, red solid line denoting the same as line AB in Fig. 1, blue triangle for cloud cluster above the Kuroshio Front), distribution of cloud optical thickness (b, red solid line) along line AB in Fig. 1 (magenta solid line on horizontal axis for position of the Kuroshio Front, the same hereinafter), liquid water path (c, green solid line, units: kg·m-2), and cloud effective particle radius (d, blue solid line, units: μm) at 05:00 UTC 30 April 2018 |
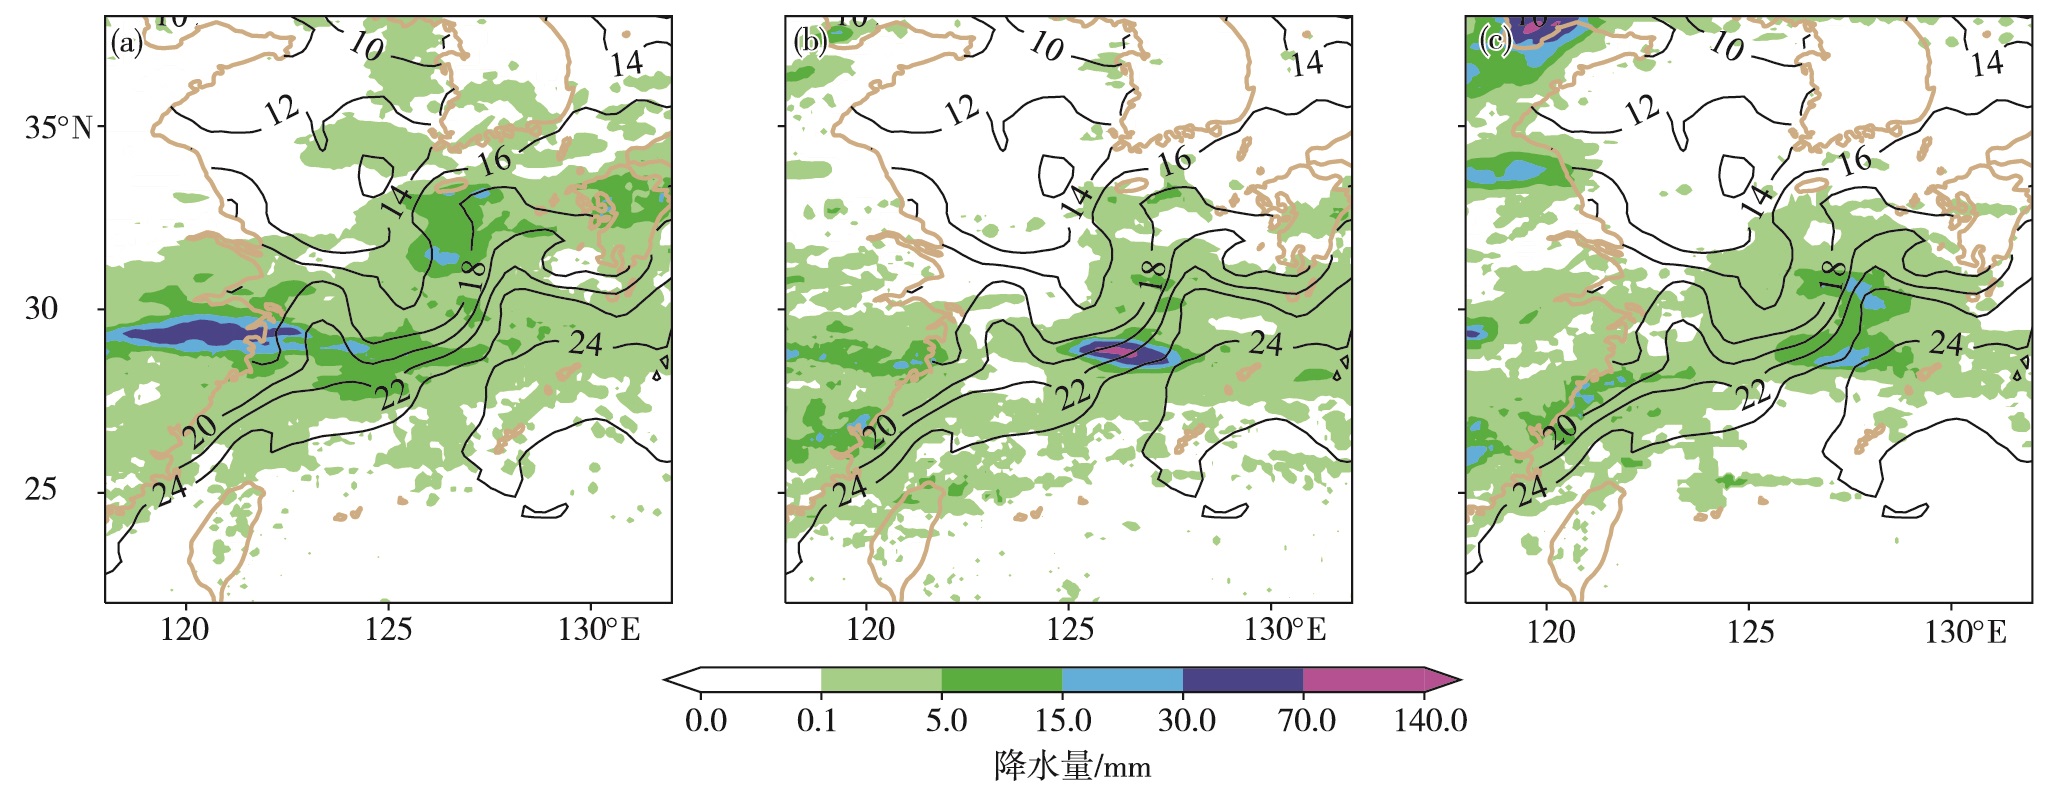
30日00—12时黑潮锋上方累计降水量达30 mm以上(图 3b),为暴雨以上级别,但该时段前后12 h累计降水量均在15 mm以下(图 3a、c)。小时降水中心表现出自西向东移动的特征,但当其移动至东海黑潮锋区时,小时降水中心强度增强,且移动速度变慢(图略),从而导致30日00—12时的累计降水量增加。这些特征进一步表明,黑潮锋上空生成了对流云团,并伴随强降水。这种云雨在黑潮锋附近突然加强形成的机理是什么?
|
图 3 12 h累计降水量(色阶,单位:mm;a. 4月29日12时—4月30日00时,b. 4月30日00—12时,c. 4月30日12时—5月1日00时;降水数据来自IMERG Final Precipitation)叠加SST(等值线,单位:℃) Fig.3 Accumulated precipitation of 12 hours (color scale, units: mm; a. from 12:00 UTC 29 to 00:00 UTC 30 April, b. from 00:00 UTC to 12:00 UTC 30 April, c. from 12:00 UTC 30 April to 00:00 UTC 1 May; precipitation data from IMERG Final Precipitation) superimposed with SST (isoline, units: ℃) |
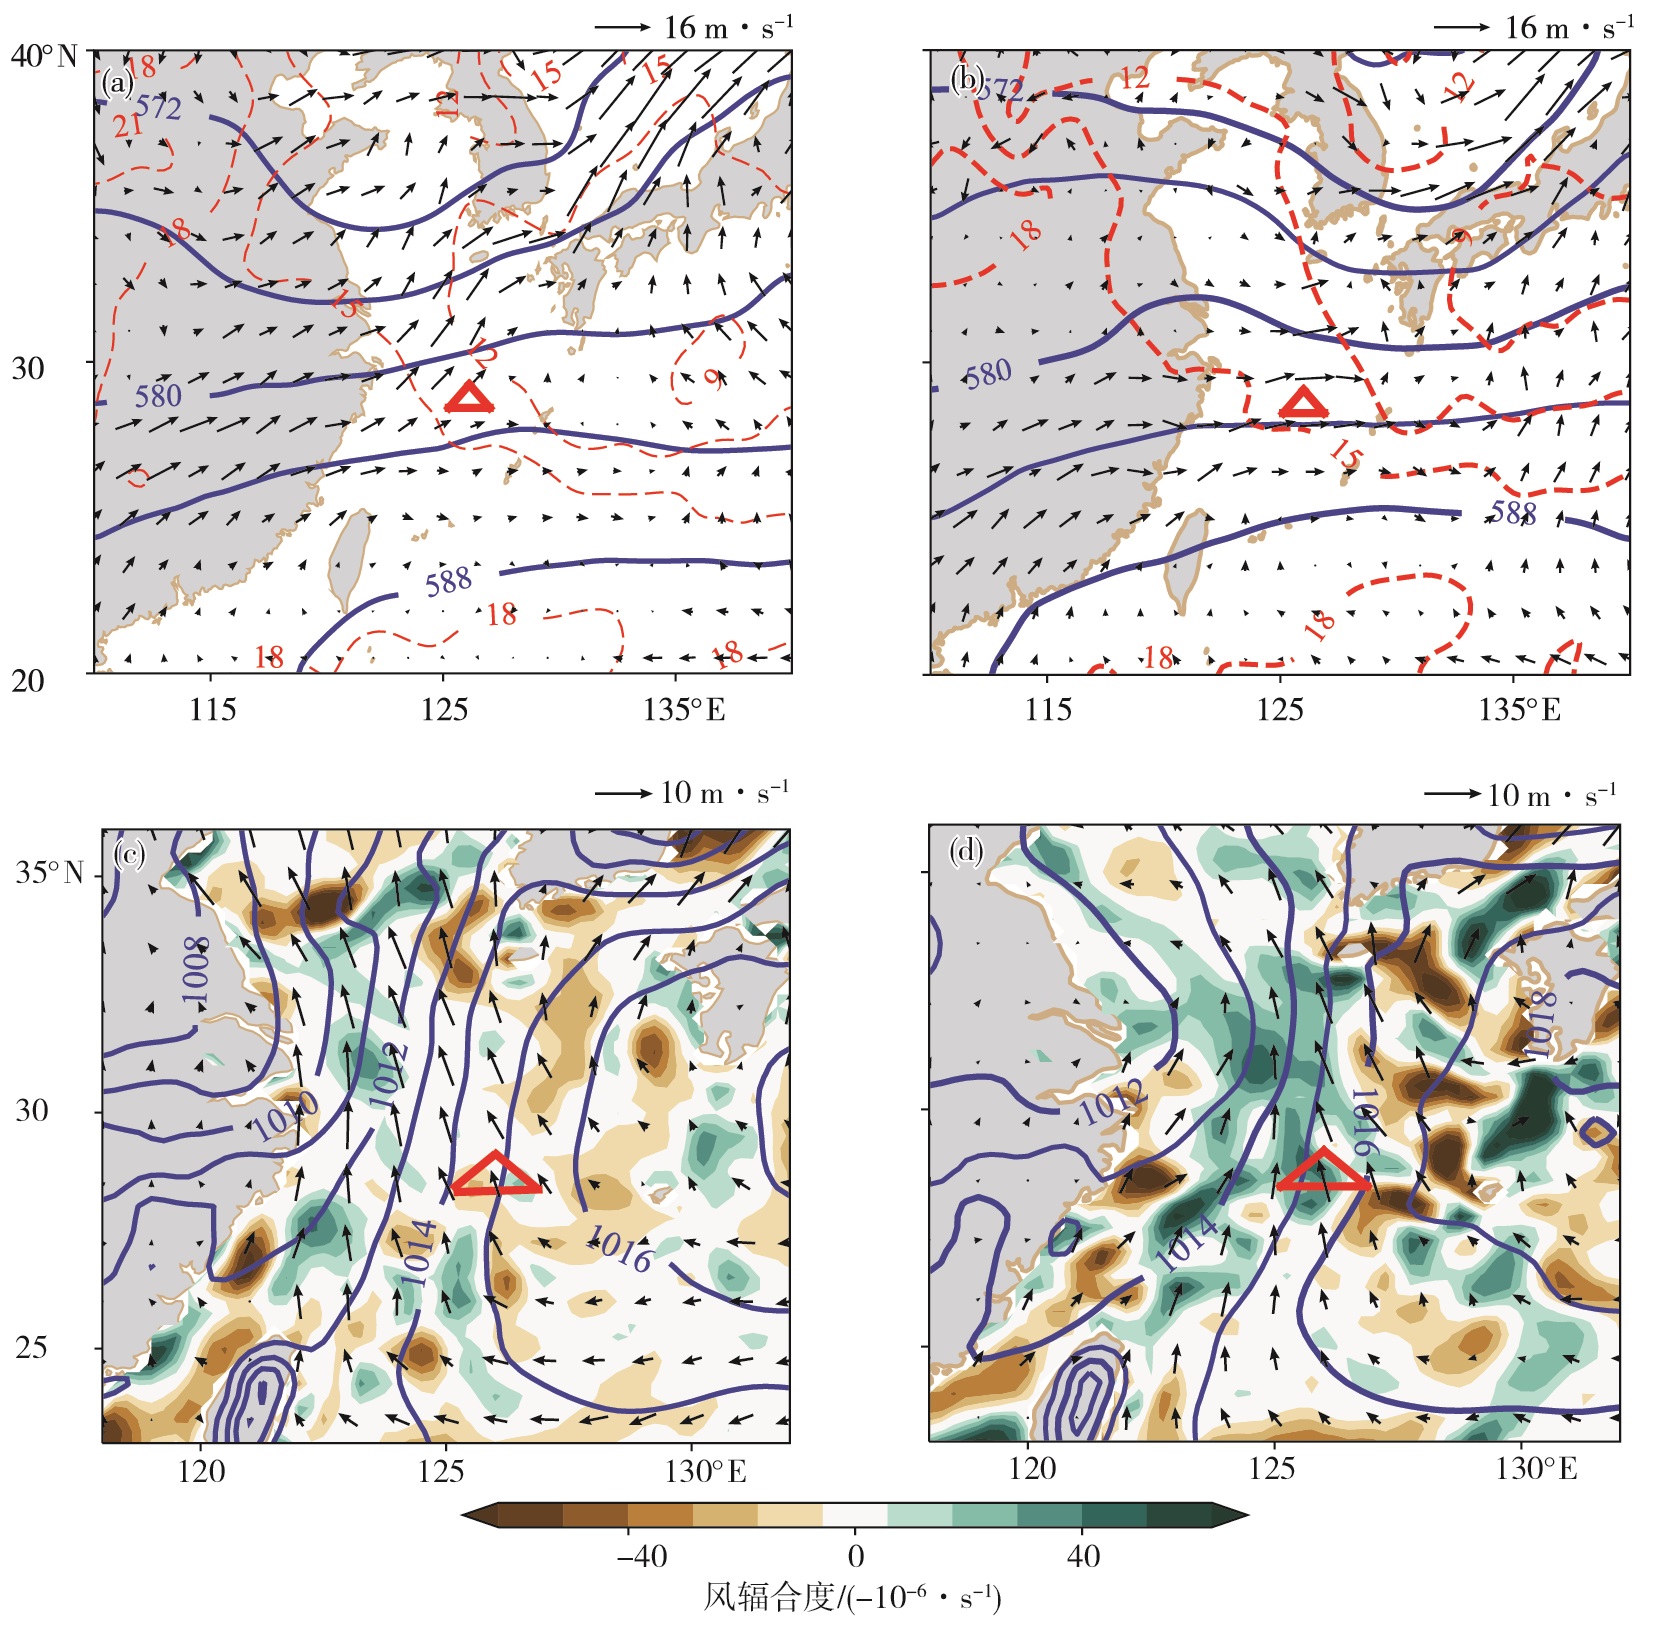
图 4红色三角形代表黑潮锋上方对流云团的位置(图 2),视为本研究的目标区。2018年4月29日12时—30日00时,500 hPa高度上东海位于副热带高压的北侧,受短波槽影响(图 4a、b)。850 hPa为西南风,风速为8~12 m·s-1。海平面气压场上,东海处于大陆低压和太平洋高压之间,30日00时受东南风与西南风影响出现大片风辐合区(图 4c、d)。高空短波槽携带弱冷空气东移南下,西南气流带来暖湿空气,低空处于偏南气流中,这种高低空天气形势为东海海区出现云和降水提供了条件。
|
图 4 500 hPa高度场(蓝色等值线,单位:dagpm)、850 hPa风场(风矢,单位:m·s-1)和温度(红色虚线,单位:℃)(a、b)以及海平面气压场(等值线,单位:hPa)、10 m风场(风矢,单位:m·s-1)和风辐合度(色阶,单位:-10-6 s-1)(c、d)(a、c. 2018年4月29日12时,b、d. 30日00时;红色三角形代表对流云团位置) Fig.4 Geopotential height (blue isoline, units: dagpm) at 500 hPa, wind field (wind barb, units: m·s-1) at 850 hPa, and temperature (red dashed line, units: ℃) at 850 hPa (a/b) and sea-level pressure (isoline, units: hPa), wind filed (wind barb, units: m·s-1) at 10 m, and wind convergence (color scale, units: -10-6 s-1) at 10 m (c/d) at 12:00 UTC 29 (a/c) and 00:00 UTC 30 (b/d) April 2018 (red triangle for position of convective cloud cluster) |
由图 3a可以看出,东海有大范围的降水,降水中心从陆地到海上呈纬向分布。但仅仅根据天气形势并不能完全解释30日00—12时目标区对流云团的迅速发展和降水的明显增强(图 3b)。30日12时东海逐渐转为高压脊控制,西南气流减弱,导致降水减弱。
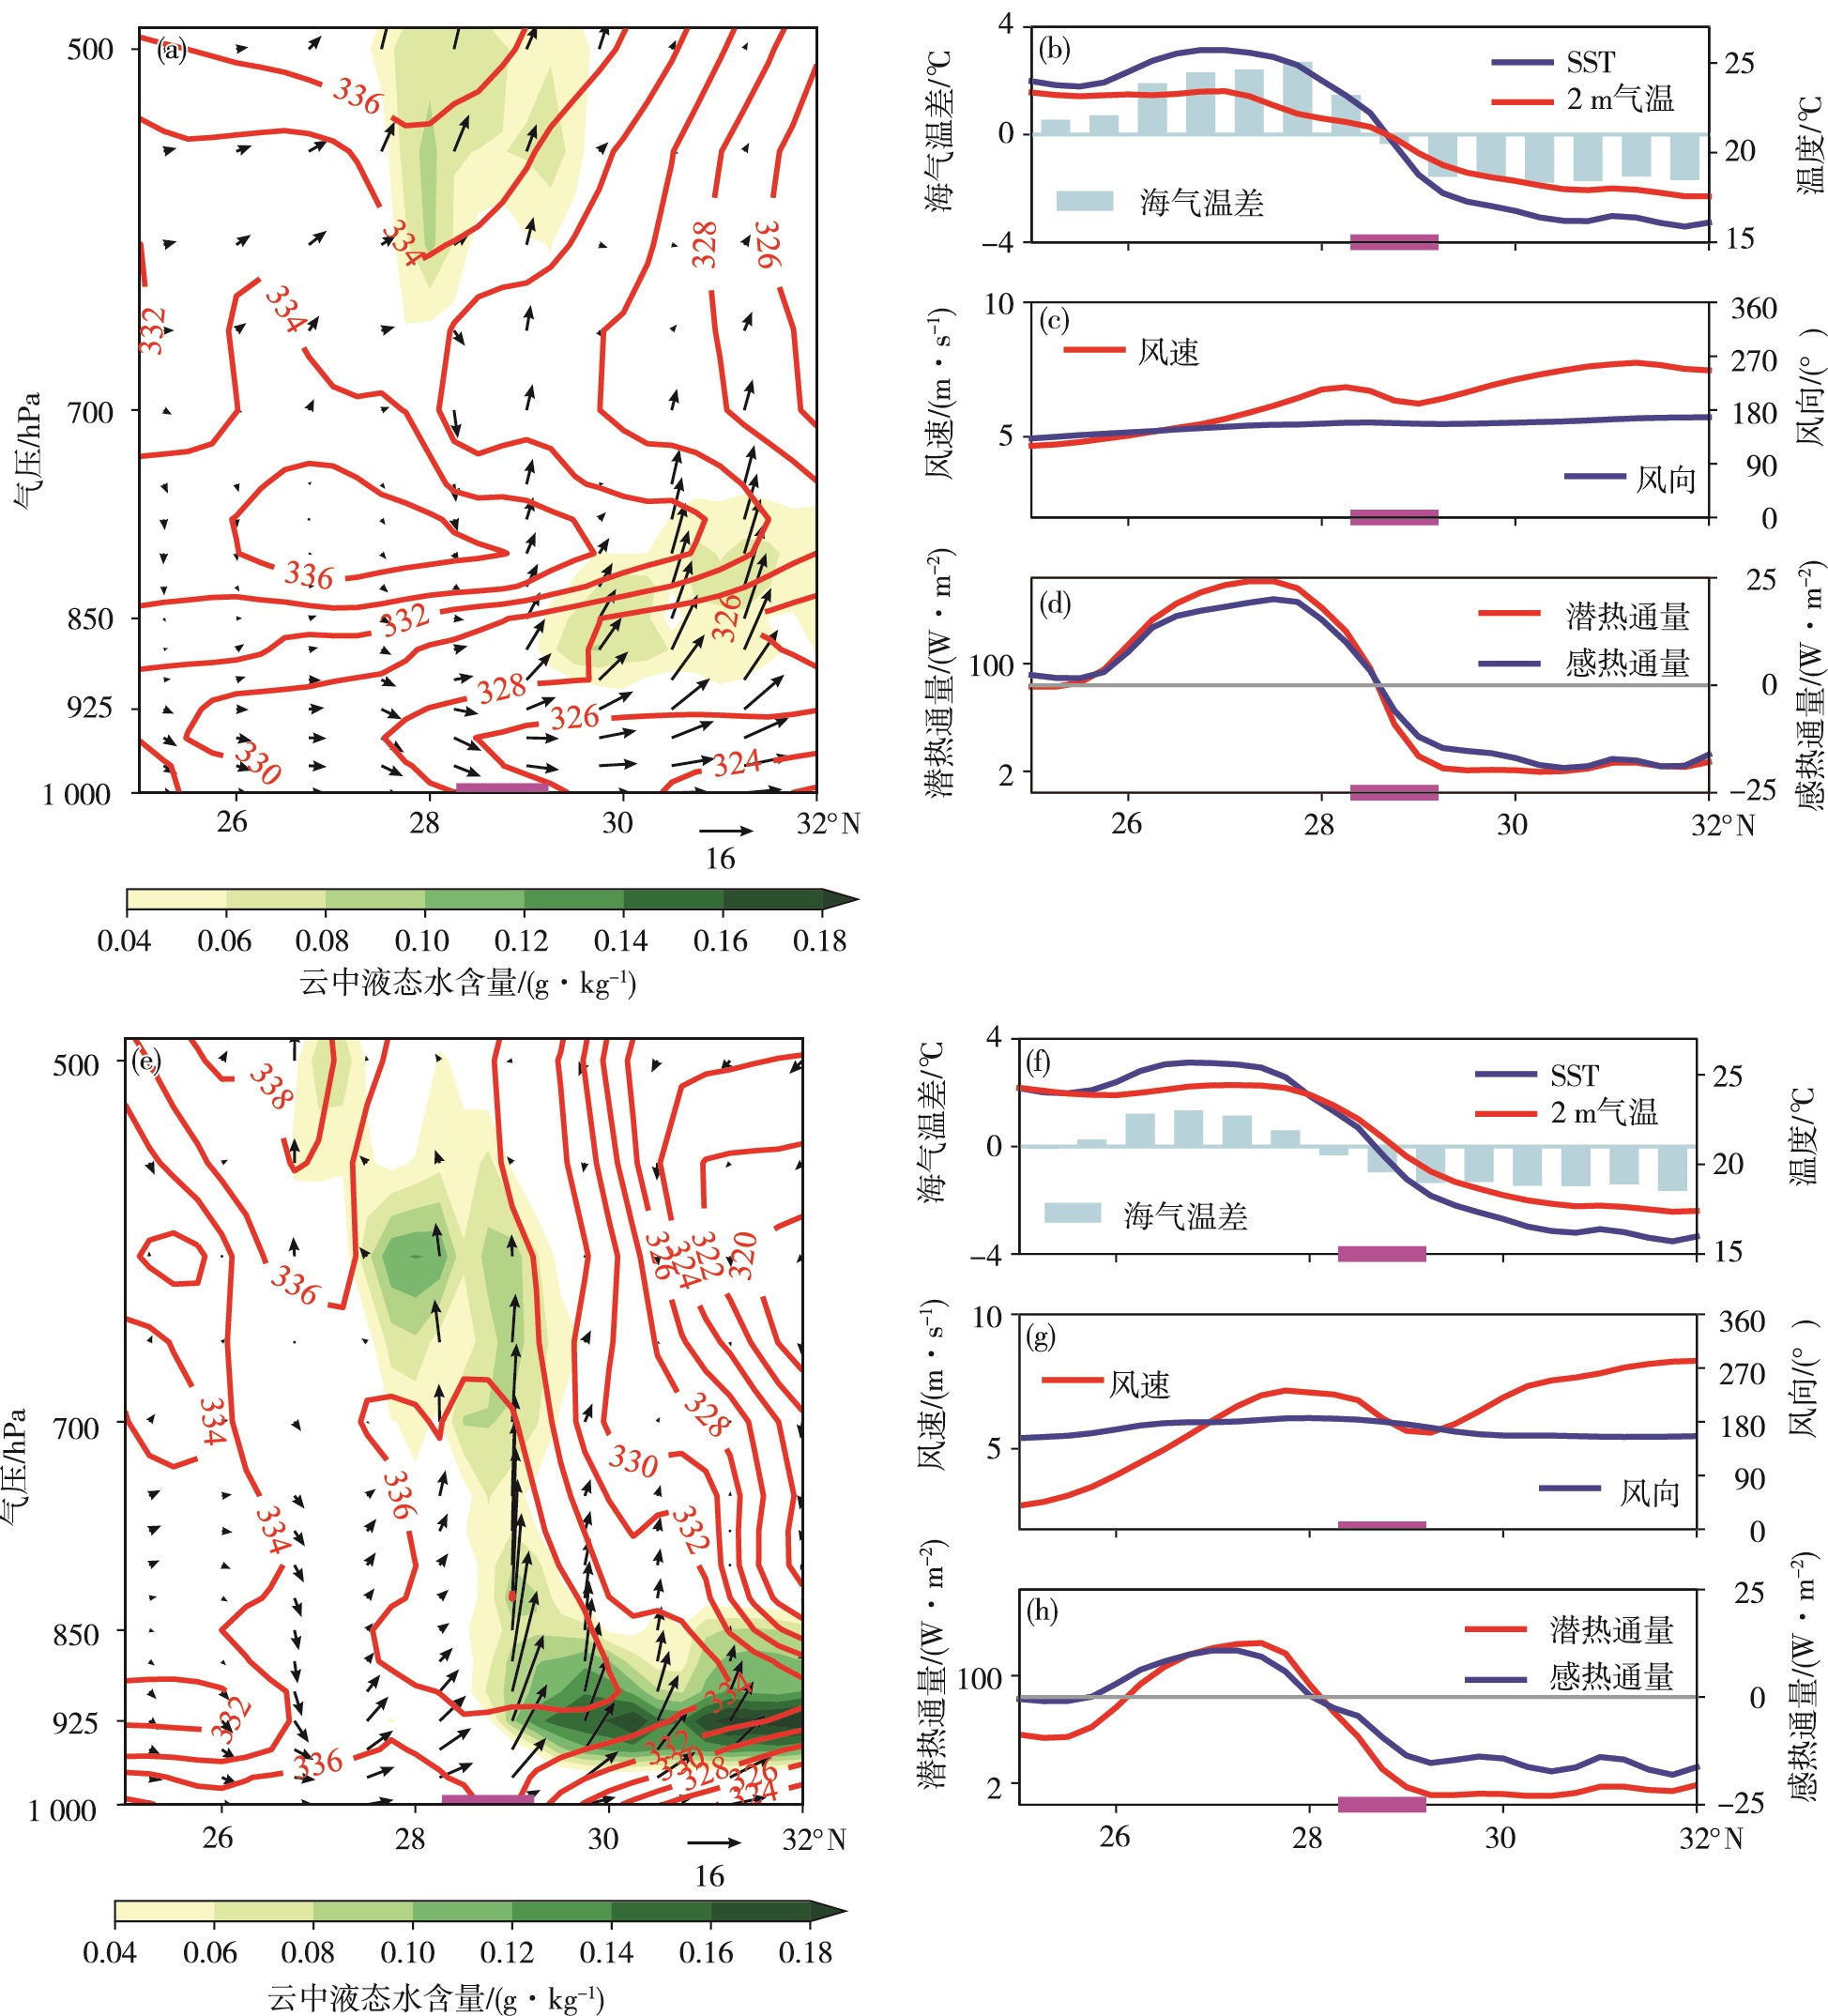
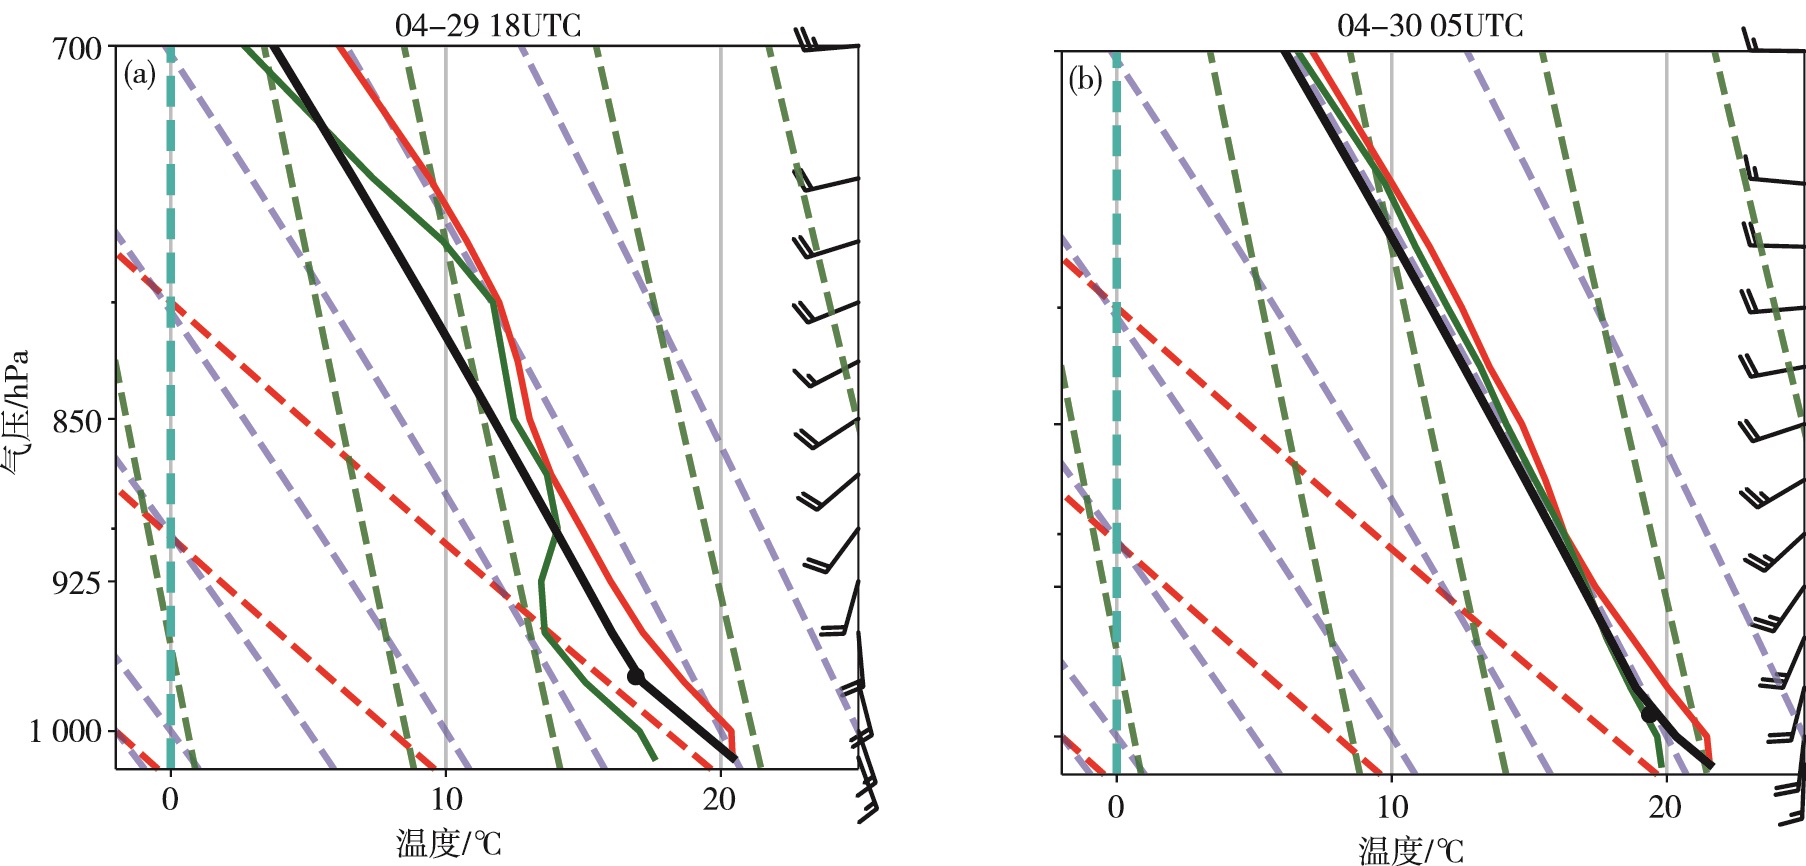
4 对流云团的爆发 4.1 边界层垂直结构分析沿126°E作相当位温θe的经向剖面,29日12时—30日00时黑潮锋上方边界层高度在850 hPa左右,边界层内存在低云,大气层结呈现弱稳定性(图 5a)。黑潮锋边界层顶下方和黑潮锋北侧850 hPa附近均为上升运动,范围较大。根据ω方程,暖平流区对应上升运动(图 4a)。以上表明西南气流携带大量水汽,配合上升运动在黑潮锋上空形成低云和降水。由29日18时黑潮锋区单点(28.75°N,126°E)的温湿廓线(图 6a)可以更清楚地看出,大气低层温度随高度的变化接近干绝热递减率,温度露点差较大;925 hPa向上至850 hPa大气的露点温度随高度明显增加,温度露点差减小,风为西南风,对应云的生成。
|
图 5 沿126°E经向剖面的云中液态水含量(色阶,单位:g·kg-1)、相当位温θe(红色等值线,单位:K)、经向风(单位:m·s-1)和垂直速度(单位:-10-1 Pa·s-1)的合成(风矢)(a、e),2 m气温(红色实线)、SST(蓝色实线)和海气温差(蓝柱)的分布(b、f,单位:℃),10 m风速(红色实线,单位:m·s-1)和风向(蓝色实线,单位:°)的分布(c、g)以及潜热通量(红色实线)和感热通量(蓝色实线)的分布(d、h,单位:W·m-2)(a—d. 4月29日12时—30日00时平均,e—h. 4月30日00—12时平均;以上数据来自于ERA5) Fig.5 Cloud liquid water content (color scale, units: g·kg-1), equivalent potential temperature θe (red isoline, units: K), and wind (wind barb) composed of meridional wind (units: m·s-1) and vertical velocity (units: -10-1 Pa·s-1) (a/e); sea air temperature (SAT; red solid line) at 2 m, SST (blue solid line), and sea-air temperature difference (blue bar) (b/f, units: ℃); wind speed (red solid line, units: m·s-1) and wind direction (blue solid line, unis: °) at 10 m (c/g); latent heat flux (red solid line) and sensible heat flux (blue solid line) (d/f, units: W·m-2) (a-d for average values from 12:00 UTC 29 to 00:00 UTC 30 April and e-h for average values from 00:00 UTC to 12:00 UTC 30 April along meridional section of 126°E; data from ERA5) |
|
图 6 2018年4月29日18时(a)和30日05时(b)黑潮锋单点(28.75°N,126°E)的温湿度廓线(黑色实线为气块绝热上升时温度变化曲线,红色实线为温度,绿色实线为露点温度,红色虚线为干绝热线,紫色虚线为湿绝热线,灰色实线为等温线,单位均为℃;风矢,单位:kt;绿色虚线为等饱和比湿线,单位:g·kg-1;蓝色虚线为0 ℃线;以上数据来自于ERA5) Fig.6 Vertical profile of temperature and humidity at a point (28.75°N, 126°E) of the Kuroshio Front at 18:00 UTC 29 (a) and 05:00 UTC 30 (b) April 2018 (black solid line for temperature curve of air parcel during adiabatic ascending, red solid line for temperature, green solid line for dew point, red dashed line for dry adiabat, purple dashed line for moist adiabat, gray solid line for isotherm, units: ℃; wind barb, units: kt; green dashed line for isohume, units: g·kg-1; blue dashed line for isotherm of 0 ℃; data from ERA5) |
30日00—12时黑潮锋上空已经没有明显的边界层顶,从海面到700 hPa以上均为较强的上升运动,云层垂直向上发展,云内的θe相对均匀(图 5e),对应卫星监测到的对流云团和中尺度强降水中心。相比图 6a,图 6b中925 hPa以下露点温度和温度进一步增加,抬升凝结高度下降,饱和层厚度显著增加,层结曲线更趋于湿绝热温度递减率。
4.2 东海黑潮锋的影响29日12时—30日00时期间黑潮锋暖水侧(27°N左右)的海气界面不稳定(海气温差>0 ℃,图 5b),感热通量达20 W·m-2,潜热通量达180 W·m-2(图 5d),表明海洋向大气输送热量和水汽[29],低空大气增温增湿,不稳定性加强(
根据垂直混合机制[22-23],黑潮锋的暖水侧边界层处于不稳定状态时,湍流混合加强,有助于边界层顶动量下传至海表面,使表层风速增加,反之冷水侧边界层稳定,湍流弱,不利于动量的垂直传输,风速减弱(图 7a)。30日00—12时风散度与顺风方向SST梯度大致成线性相关,相关系数为0.73(图 7b),明显超过气候态东南风背景下两者的相关系数[30]。在该时段的前12 h内,黑潮锋区域风速减弱的特征并不明显,风散度与顺风方向SST梯度间的相关性一般,可能与背景风速较弱有关。因此以上表明29日12时开始,经过约12 h的调整后,30日00—12时表层风辐合对黑潮锋的强迫产生显著的响应[31]。

|
图 7 2018年4月30日00—12时平均的10 m风场(风矢,单位:m·s-1)、10 m风速(色阶,单位:m·s-1)和SST(等值线,单位:℃)的分布(a)以及SST梯度顺风分量(单位:10-2 ℃·km-1)和散度(单位:10-5 s-1)的散点图(b;所选区域为a中白色方框,相关系数通过了99%的显著性检验) Fig.7 Average wind field (wind barb, units: m·s-1) at 10 m, wind speed (color scale, units: m·s-1) at 10 m, and SST (isoline, units: ℃) (a) and scatter of downwind SST gradient (units: 10-2 ℃·km-1) and wind divergence (units: 10-5 s-1) (b; the selected area is the white rectangle in Fig. 7a and the correlation coefficient passes significance test at 99% level) from 00:00 UTC to 12:00 UTC 30 April 2018 |
由于海平面气压场上的高低压导致黑潮锋区东南风和西南风的辐合,而黑潮锋主要通过垂直混合机制影响经向风风速的变化。计算30日00—12时期间纬向风变化造成的辐合(-du/dx),强度达-3.2×10-5 s-1(图 8a);以及经向风速减弱造成的辐合(-dv/dy),强度达-1.6×10-5 s-1(图 8b),比该时段前12 h的强1.2×10⁻⁵ s-1(图 8c)。由此可知30日00—12时期间黑潮锋的强迫明显,并在天气扰动的基础上导致风辐合强度增加了近一半。此外,黑潮锋区海气界面处的感热和潜热通量明显比暖水侧的少,但在平流效应影响下黑潮锋的低空大气增温增湿(图 6),对流不稳定发展(

|
图 8 2018年4月30日00时—12时平均的10 m纬向风辐合(-du/dx,色阶,单位:-10-6 s-1)和10 m风场(风矢)分布(a)、10 m经向风辐合(-dv/dy,色阶,单位:-10-6 s-1)和10 m风场(风矢)分布(b)以及经向风辐合的差(c;b与前12 h的差)(等值线为叠加SST,单位:℃) Fig.8 Distribution of zonal component of wind convergence (-du/dx, color scale, units: -10-6 s-1) at 10 m and wind field (wind barb) at 10 m (a) & distribution of meridional component of wind convergence (-dv/dy, color scale, units: -10-6 s-1) at 10 m and wind field (wind barb) at 10 m averaged from 00:00 UTC to 12:00 UTC 30 April 2018(b) & difference (c) between Fig. 8b and 12 h before (isoline for superimposed SST, units: ℃) |
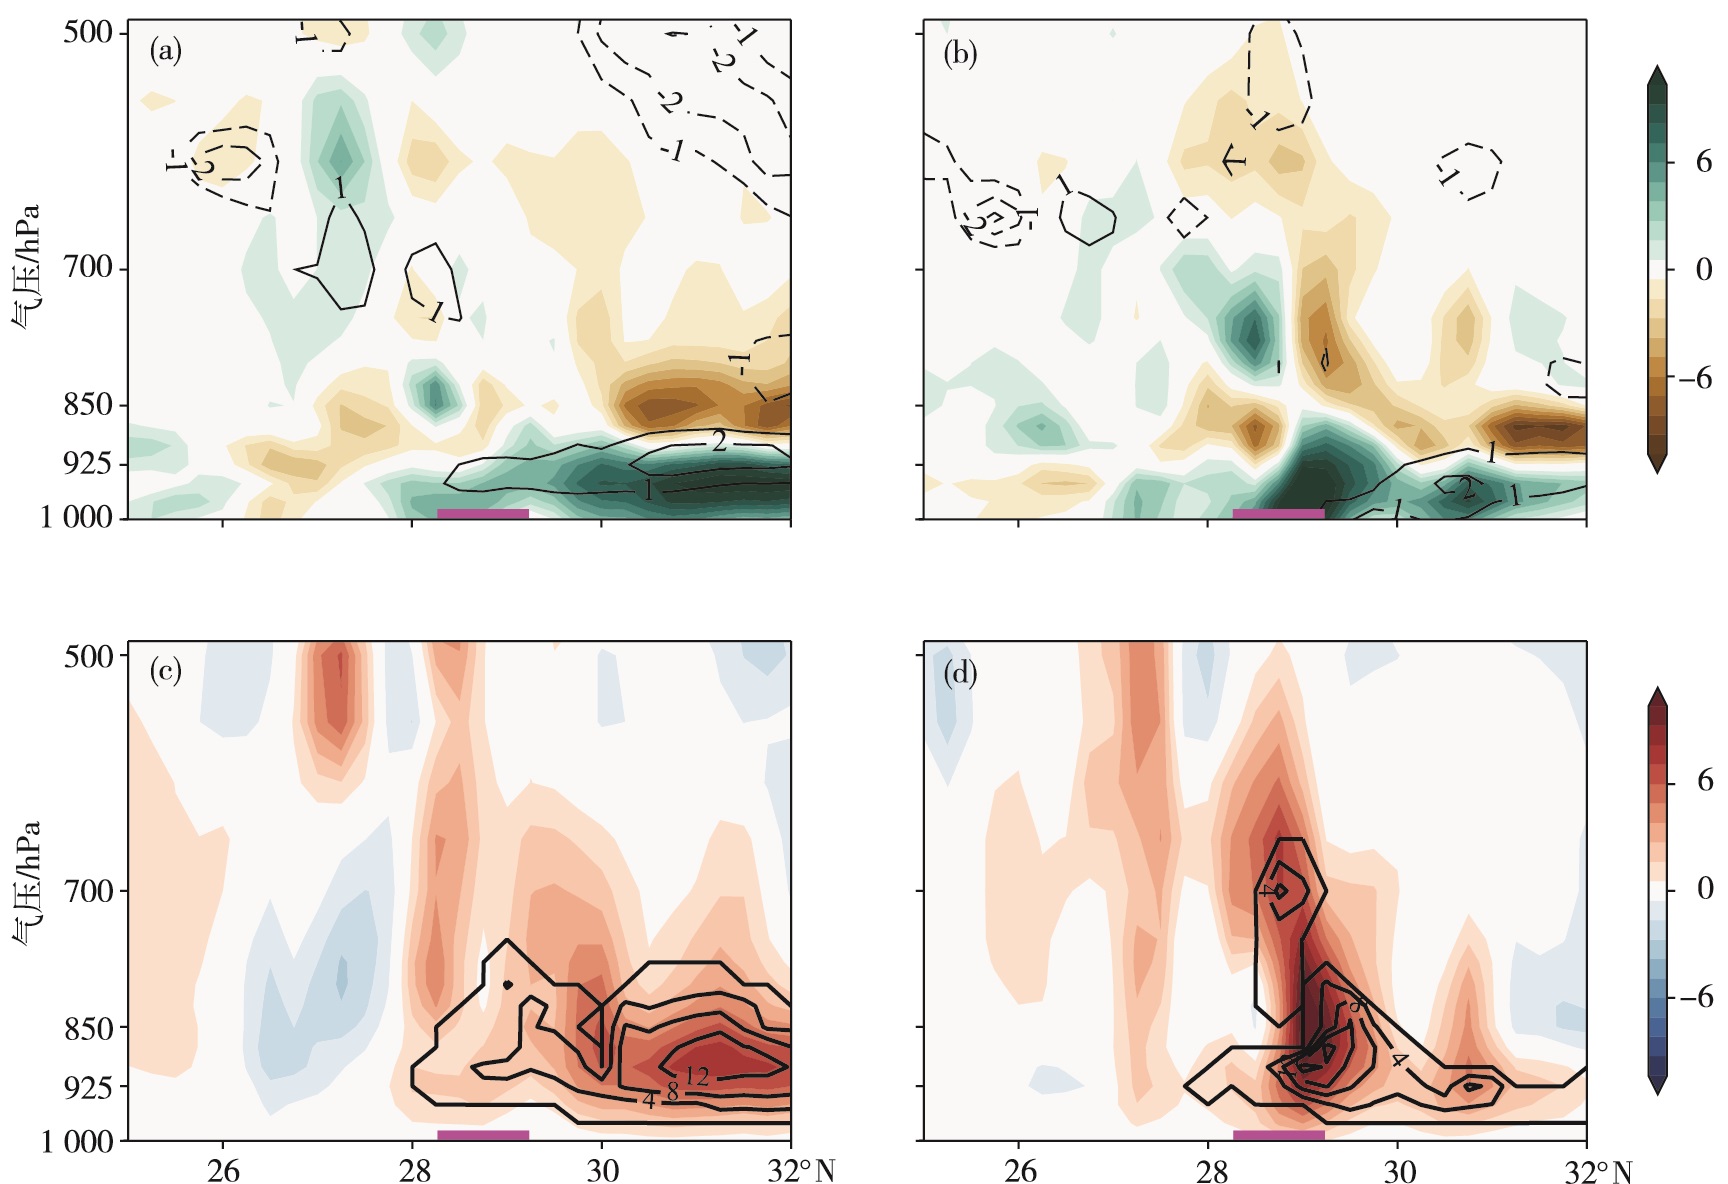
结合公式(1),30日00时黑潮锋上方水汽通量辐合中的水汽平流项强度达-10-7 g·cm-2·hPa-1·s-1,与风的辐合项相当(图 9a),有利于强降水前增加比湿。05时对流云团发展时风的辐合项更强,达-10-6 g·cm-2·hPa-1·s-1,受偏南气流影响随高度向北倾斜(图 9b)。
|
图 9 2018年4月30日00时(a、c)和05时(b、d)水汽平流项(等值线)和风的辐合项(色阶)(a、b,单位:-10-7 g·cm-2·hPa-1·s-1))以及垂直速度(色阶,单位:-10-1 Pa·s-1)和潜热加热(等值线,单位:10-1 K·h-1)(c、d)纬向(125.75°~126.25°E)平均的经向-高度剖面 Fig.9 Latitude-height section of moisture advection term (isoline) and wind convergence term (color scale) (a/b, units: -10-7 g·cm-2·hPa-1·s-1) & section of vertical velocity (color scale, units: -10-1 Pa·s-1) and latent heat release (isoline, units: 10-1 K·h-1) (c/d) averaged between 125.75°E and 126.25°E at 00:00 UTC (a/c) and 05:00 UTC (b/d) 30 April 2018 |
由公式(2)和公式(3)可知,水汽凝结释放的潜热与凝结函数F和上升速度的乘积成正比,且满足空气饱和的条件,所以00时潜热释放主要位于925~850 hPa间,强度为0.4 K·h-1左右(图 9c),对应上升运动和饱和层(图略)。05时低层水汽通量辐合增强,上升运动显著增强,凝结潜热高值中心强度达1.6 K·h-1(图 9d)。
经过约12 h的调整,黑潮锋在垂直混合机制的影响下强迫风速减弱,叠加天气扰动的影响,锋区上方辐合强。30日00—05时水汽在黑潮锋上方辐合抬升凝结,释放的潜热可能导致空气增温,产生更强的上升运动、低层水汽辐合和高层水汽辐散(图 9a、b)。换言之,本次强对流过程中很有可能存在水汽辐合抬升和凝结潜热释放间的正反馈机制。由前人研究[9, 32]也可知,潜热释放和正反馈机制在将海洋锋的影响从大气边界层传递到对流层过程中起着重要作用。
30日05时黑潮锋700 hPa上还存在一个偏弱的上升中心,有潜热释放(图 9d),表明此正反馈机制可能影响到了700 hPa,或者低层的潜热被输送到高层,促进上升运动发展[33]。
5 结论根据卫星观测和再分析数据,本文分析了2018年4月30日东海黑潮锋附近一次对流云团发展,且伴随强降水天气的过程,发现00—12时对流云团发展和降水强度增强是黑潮锋强迫和天气扰动相配合的结果。以下为主要结论:
(1)29日12时—30日00时,东海500 hPa上受短波槽的控制,低层为西南暖湿气流,海平面气压场上位于陆地低压和海上高压之间,由此出现大范围降水。黑潮锋上空大气边界层相对稳定,暖湿空气抬升形成低云。
(2) 29日12时—30日00时,黑潮锋的暖水侧潜热(约180 W·m-2)和感热通量(约20 W·m-2)均达到最大,边界层稳定性减弱(
(3) 经过约12 h的调整,30日00—12时黑潮锋强迫冷水侧表层风速减弱,风散度与顺风方向SST梯度的相关性高达0.73,说明表层风对黑潮锋有所响应,并以垂直混合机制的作用为主。其中黑潮锋强迫的风辐合强度达-1.6×10⁻⁵ s-1,叠加天气扰动的影响,促进低云发展为对流云团。
(4) 黑潮锋上方水汽抬升凝结,释放的潜热可能又反过来加强抬升,从而构成正反馈过程。潜热释放和此正反馈过程对文中对流云团的发展和降水的增强有一定影响。
本文的结论主要是通过分析春季东海黑潮锋区域一次较为明显的强对流天气过程得到的,其中海洋锋强迫大气的物理过程还可通过数值模拟和数值试验等进一步验证。
| [1] |
刘达, 王慧, 黄彬, 等. 2021年春季海洋天气评述[J]. 海洋气象学报, 2021, 41(3): 11-23. |
| [2] |
冯士筰, 李凤岐, 李少菁. 海洋科学导论[M]. 北京: 高等教育出版社, 1999: 437.
|
| [3] |
鲍献文, 万修全, 高郭平, 等. 渤海、黄海、东海AVHRR海表温度场的季节变化特征[J]. 海洋学报, 2002, 24(5): 125-133. DOI:10.3321/j.issn:0253-4193.2002.05.015 |
| [4] |
XIE S P, HAFNER J, TANIMOTO Y, et al. Bathymetric effect on the winter sea surface temperature and climate of the Yellow and East China Seas[J]. Geophys Res Lett, 2002, 29(24): 2228. |
| [5] |
ZHANG S P, LIU J W, XIE S P, et al. The formation of a surface anticyclone over the Yellow and East China Seas in spring[J]. J Meteor Soc Japan, 2011, 89(2): 119-131. DOI:10.2151/jmsj.2011-202 |
| [6] |
SASAKI Y N, ASAIM T, INATSU M. Influence of the Kuroshio in the East China Sea on the early summer (Baiu) rain[J]. J Climate, 2012, 25(19): 6627-6645. DOI:10.1175/JCLI-D-11-00727.1 |
| [7] |
LONG J C, WANG Y Q, ZHANG S P, et al. Transition of low clouds in the East China Sea and Kuroshio region in winter: a regional atmospheric model study[J]. J Geophys Res: Atmos, 2020, 125(17): e2020JD032509. |
| [8] |
XU H M, XU M M, XIE S P, et al. Deep atmospheric response to the spring Kuroshio over the East China Sea[J]. J Climate, 2011, 24(18): 4959-4972. DOI:10.1175/JCLI-D-10-05034.1 |
| [9] |
MINOBE S, KUWANO-YOSHIDA A, KOMORI N, et al. Influence of the Gulf Stream on the troposphere[J]. Nature, 2008, 452(7184): 206-209. DOI:10.1038/nature06690 |
| [10] |
TOKINAGA H, TANIMOTO Y, XIE S P, et al. Ocean frontal effects on the vertical development of clouds over the western North Pacific: in situ and satellite observations[J]. J Climate, 2009, 22(16): 4241-4260. DOI:10.1175/2009JCLI2763.1 |
| [11] |
KUWANO-YOSHIDA A, MINOBE S, XIE S P. Precipitation response to the Gulf Stream in an atmospheric GCM[J]. J Climate, 2010, 23(13): 3676-3698. DOI:10.1175/2010JCLI3261.1 |
| [12] |
LIU J W, XIE S P, YANG S, et al. Low-cloud transitions across the Kuroshio front in the East China Sea[J]. J Climate, 2016, 29(12): 4429-4443. DOI:10.1175/JCLI-D-15-0589.1 |
| [13] |
LI M, ZHANG S P. Impact of sea surface temperature front on stratus-sea fog over the Yellow and East China Seas: a case study with implications for climatology[J]. J Ocean Univ China, 2013, 12(2): 301-311. DOI:10.1007/s11802-013-2218-5 |
| [14] |
宫庆龙, 刁一娜. 冷空气过程对黄海东海区域海洋大气边界层结构影响的个例分析[J]. 海洋气象学报, 2018, 38(1): 51-61. |
| [15] |
ZHANG Z W, LI Y Y. Spring planetary boundary layer structure and corresponding cloud characteristics under different prevailing wind directions over the Kuroshio sea surface temperature front in the East China Sea[J]. J Geophys Res: Atmos, 2020, 125(23): e2020JD034006. |
| [16] |
TANIMOTO Y, XIE S P, KAI K, et al. Observations of marine atmospheric boundary layer transitions across the summer Kuroshio Extension[J]. J Climate, 2009, 22(6): 1360-1374. DOI:10.1175/2008JCLI2420.1 |
| [17] |
张苏平, 王媛, 衣立, 等. 一次层积云对黑潮延伸体海洋锋强迫的响应研究—观测与机制分析[J]. 大气科学, 2017, 41(2): 227-235. |
| [18] |
杨爽, 刘敬武, 张苏平. 低云在不同季节对东海黑潮海洋锋响应的个例研究[J]. 中国海洋大学学报(自然科学版), 2015, 45(10): 7-17. |
| [19] |
JIANG Y X, ZHANG S P, XIE S P, et al. Effects of a cold Ocean eddy on local atmospheric boundary layer near the Kuroshio Extension: in situ observations and model experiments[J]. J Geophys Res: Atmos, 2019, 124(11): 5779-5790. DOI:10.1029/2018JD029382 |
| [20] |
CHOW C H, LIU Q Y, XIE S P. Effect of Kuroshio intrusions on the atmosphere northeast of Taiwan Island[J]. Geophys Res Lett, 2015, 42(5): 1465-1470. DOI:10.1002/2014GL062796 |
| [21] |
MA J, XU H M, DONG C M, et al. Atmospheric responses to oceanic eddies in the Kuroshio Extension region[J]. J Geophys Res: Atmos, 2015, 120(13): 6313-6330. DOI:10.1002/2014JD022930 |
| [22] |
HAYES S P, McPHADEN M J, WALLACE J M. The influence of sea-surface temperature on surface wind in the eastern equatorial Pacific: weekly to monthly variability[J]. J Climate, 1989, 2(12): 1500-1506. DOI:10.1175/1520-0442(1989)002<1500:TIOSST>2.0.CO;2 |
| [23] |
WALLACE J M, MITCHELL T P, DESER C. The influence of sea-surface temperature on surface wind in the eastern equatorial Pacific: seasonal and interannual variability[J]. J Climate, 1989, 2(12): 1492-1499. DOI:10.1175/1520-0442(1989)002<1492:TIOSST>2.0.CO;2 |
| [24] |
LINDZEN R S, NIGAM S. On the role of sea surface temperature gradients in forcing low-level winds and convergence in the tropics[J]. J Atmos Sci, 1987, 44(17): 2418-2436. DOI:10.1175/1520-0469(1987)044<2418:OTROSS>2.0.CO;2 |
| [25] |
HUANG B Y, LIU C Y, BANZON V, et al. Improvements of the Daily Optimum Interpolation Sea Surface Temperature (DOISST) Version 2.1[J]. J Climate, 2021, 34(8): 2923-2939. DOI:10.1175/JCLI-D-20-0166.1 |
| [26] |
朱乾根, 林锦瑞, 寿绍文, 等. 天气学原理和方法[M]. 3版. 北京: 气象出版社, 2000.
|
| [27] |
陈渭民. 卫星气象学[M]. 3版. 北京: 气象出版社, 2017.
|
| [28] |
刘健, 许健民, 方宗义. 利用NOAA卫星的AVHRR资料试分析云和雾顶部粒子的尺度特征[J]. 应用气象学报, 1999, 10(1): 28-33. DOI:10.3969/j.issn.1001-7313.1999.01.004 |
| [29] |
刘甜甜, 盛立芳, 毕雪岩, 等. 一次春季冷空气过程中东海海域海气通量与界面热交换分析[J]. 海洋气象学报, 2018, 38(4): 28-37. |
| [30] |
XU M M, XU H M. Atmospheric responses to Kuroshio SST front in the East China Sea under different prevailing winds in winter and spring[J]. J Climate, 2015, 28(8): 3191-3211. DOI:10.1175/JCLI-D-13-00675.1 |
| [31] |
CHELTON D B, XIE S P. Coupled ocean-atmosphere interaction at oceanic mesoscales[J]. Oceanogr, 2010, 23(4): 52-69. DOI:10.5670/oceanog.2010.05 |
| [32] |
刘秦玉, 张苏平, 贾英来. 冬季黑潮延伸体海域海洋涡旋影响局地大气强对流的研究[J]. 地球科学进展, 2020, 35(5): 441-451. |
| [33] |
张舒阳, 闵锦忠. 2013年6月23日江淮地区梅雨锋暴雨的发展和维持机制[J]. 气象科学, 2018, 38(6): 707-718. |
 2022, Vol. 42


