2. 中国海洋大学海洋环境与生态教育部重点实验室,山东 青岛 266100
2. Key Laboratory of Marine Environment and Ecology of Ministry of Education, Ocean University of China, Qingdao 266100, China
臭氧污染是中国近些年面临的主要大气环境问题之一。平流层中臭氧能够保护地球生态系统,吸收紫外线。如果平流层的臭氧减少,可能会增加皮肤癌的风险[1]。但是,对流层臭氧却是大气中的主要污染物,并且由于其具有强氧化特性,浓度一旦超过自然水平就会危害人体健康及植物生长[2-6]。
近些年来,中国污染有逐渐加重的趋势,尤其是近地面臭氧污染[7-9]。作为中国最大的经济中心,长江三角洲地区(包括上海市、浙江省、江苏省和安徽省)人口众多,臭氧污染也在逐渐加重[10]。例如,CHANG et al.[11]研究发现,上海地区的臭氧浓度近些年来呈上升趋势,2006—2016年,臭氧月平均浓度增加了大约67%。因此,研究长江三角洲地区的臭氧污染机制对中国大气污染治理有重要意义。
臭氧在边界层中主要通过复杂的光化学反应生成。挥发性有机物(volatile organic compounds,VOCs)和氮氧化物(NOx ≡ NO+NO2)是生成臭氧的主要前体物[12]。在长江三角洲地区,其前体物排放相对复杂,主要存在3种不同的排放源,包括人为源(人为挥发性有机物和氮氧化物)、船舶源(以氮氧化物为主)和森林排放的天然源(以异戊二烯为主)[13]。包括工厂、汽车排放在内的人为源是臭氧生成最主要的来源[14-16],天然源对臭氧生成也有重要贡献[17-20]。许多导管植物可以向大气释放天然源挥发性有机物(biogenic volatile organic compounds,BVOCs)。据估计,2000年BVOCs的全球总释放量约为1 Pg(1015 g),其中异戊二烯约占一半[21]。由于城市树木的密度更低和更好的光照条件,城市绿地可能比天然森林释放更多的BVOCs[22]。MA et al.[18]研究表明,2017年6月华北严重臭氧污染期间,由蒸汽压差(vapor pressure deficit,VPD)、土地覆盖变化和城市景观3种贡献的臭氧日最大8 h滑动平均(maximum daily 8-hour average ozone,MDA8)浓度分别为3.08、2.79和4.74 ppb。
由于光化学反应受到气象条件的影响,比如热浪[23-24]和静稳天气[25],臭氧污染最严重的季节一般在夏季。但是,长江三角洲地区各个季节臭氧污染的情况仍需要进一步量化,尤其是天然源排放在各个季节对臭氧污染的贡献。因此,本研究分析长江三角洲地区臭氧污染不同季节的时空分布,并通过WRF-CMAQ模式定量分析天然源对不同季节臭氧生成的贡献,进一步研究臭氧污染严重时天然源排放的影响。
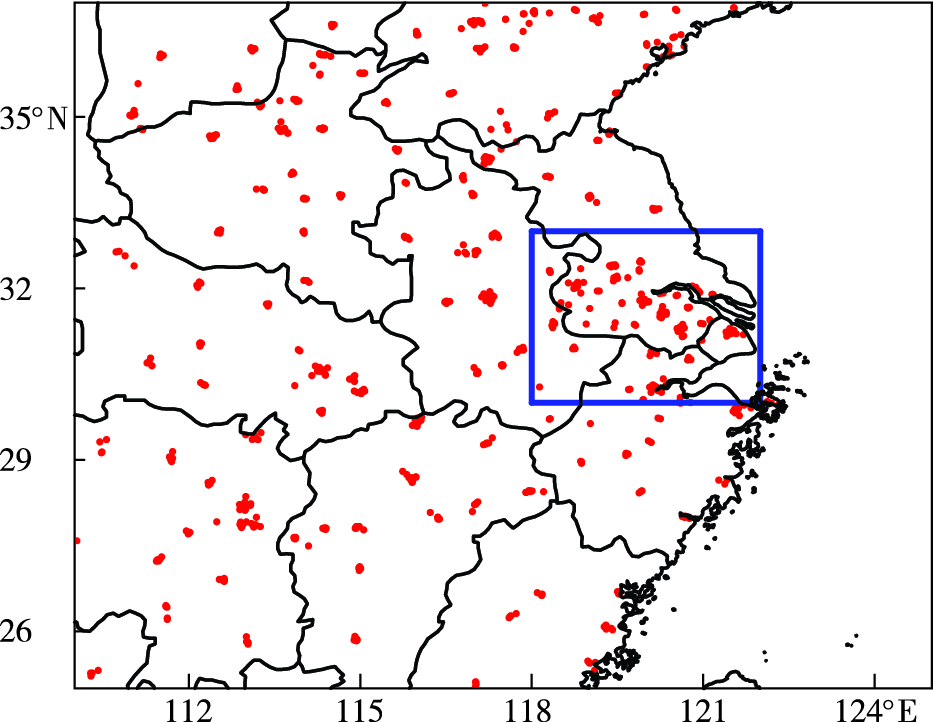
1 数据与方法 1.1 研究数据和模式参数设置臭氧日最大8 h滑动平均浓度(简称为“MDA8臭氧浓度”)的观测数据源自中国环境监测总站,站点位置如图 1所示。臭氧浓度观测数据单位为μg ·m-3,在2018年9月之前为标况大气,之后为实况大气。本研究在利用臭氧分析前,将其单位统一转换为ppb,便于不同年份数据进行比较。为了方便后续的分析,将观测数据插值为0.5°×0.5°的网格数据。采用版本4.1.1的区域天气研究及预报(Weather Research and Forecasting,WRF)模式对气象条件进行模拟。WRF模式范围可以覆盖整个中国地区,其中心位于34°N、110°E。模式的水平分辨率为36 km×36 km,在垂直方向上一共有34层,模式顶层为50 hPa。模式对2014—2019年这6 a分别进行数值模拟,前一年的12月作为每次模拟的预热(spin-up)。WRF数值模拟的参数化方案选择基于ZENG et al.[26]的研究,其中包括Morrison微物理参数化方案[27]、YSU(Yonsei University)边界层参数化方案[28]、Grell-Freitas积云参数化方案[29]和快速辐射传输模型(Rapid Radiative Transfer Model for GCMs,RRTMG)短波和长波参数化方案[30-31]。WRF模式的初始条件和边界条件选自美国国家环境预报中心(National Centers for Environmental Prediction,NCEP)气候预报系统版本2(Climate Forecast System Version 2,CFSR2)[32]。
|
图 1 臭氧观测国控环境空气质量自动监测站(简称“国控站”,红色圆点)分布(蓝色框代表长江三角洲地区) Fig.1 Distribution of state-controlled automatic air monitoring stations (red dot) for ozone observation (blue box for the Yangtze River Delta region) |
采用版本为5.3.1的社区多尺度空气质量(Community Multi-scale Air Quality,CMAQ)模式进行大气化学相关的模拟。该模式采用气溶胶模块版本7(Aerosol Module Version 7,AERO7)[33]作为气溶胶模块,碳键版本6(Carbon-bond Version 6,CB6)[34]作为气象化学模块。CMAQ模拟使用的排放源与ZENG et al.[26]使用的排放源相同:人为源为2016年,来自中国多分辨率排放清单(Multi-resolution Emission Inventory for China,MEIC,http://www.meicmodel.org)[35],空间分辨率为0.25°× 0.25°;天然源排放利用MEGAN(Model of Emissions of Gases and Aerosols from Nature)版本2.1计算[21],与GAO et al.[17]和MA et al.[36]臭氧相关的研究一致。
1.2 模拟情景介绍和评估方法设计了两个实验:第一个是对照组,输入CMAQ的排放源,包括人为源、船舶源和天然源;另一个是实验组,输入CMAQ的排放源,包括人为源和船舶源。将对照组的结果减去实验组的结果,可以定量评估天然源排放对长江三角洲地区臭氧污染的贡献。
模式评估是应用模式结果进行研究的必要前提。本研究对WRF-CMAQ模式的评估是基于ZHANG et al.[37]的研究,主要通过以下3个统计量:平均分数误差(mean fractional error,MFE)、平均分数偏差(mean fractional bias,MFB)以及相关系数(R)。3个参数的具体计算方法见公式(1)—(3):
| $ {V_{{\rm{MFE}}}} = \frac{2}{n} \times \sum\limits_{i = 1}^n {\left( {\frac{{\left| {{V_{{\rm{mode}}{{\rm{l}}_i}}} - {V_{{\rm{ob}}{{\rm{s}}_i}}}} \right|}}{{\left( {{V_{{\rm{mode}}{{\rm{l}}_i}}} + {V_{{\rm{ob}}{{\rm{s}}_i}}}} \right)}}} \right)} \times 100\% , $ | (1) |
| $ V_{\mathrm{MFB}}=\frac{2}{n} \times \sum\limits_{i=1}^n\left(\frac{V_{\mathrm{model}_i}-V_{\mathrm{obs}_i}}{V_{\mathrm{model}_i}+V_{\mathrm{obs}_i}}\right) \times 100 \%, $ | (2) |
| $ R = \frac{{\sum\limits_{i = 1}^n {\left( {{V_{{\rm{mode}}{{\rm{l}}_i}}} - {V_{\overline {{\rm{ model }}} }}} \right)} \times \left( {{V_{{\rm{ob}}{{\rm{s}}_i}}} - {V_{\overline {{\rm{obs}}} }}} \right)}}{{\sqrt {\sum\limits_{i = 1}^n {{{\left( {{V_{{\rm{mode}}{{\rm{l}}_i}}} - {V_{\overline {{\rm{ model }}} }}} \right)}^2}} } \times \sqrt {\sum\limits_{i = 1}^n {{{\left( {{V_{{\rm{ob}}{{\rm{s}}_i}}} - {V_{{\rm{obs}}}}} \right)}^2}} } }}, $ | (3) |
其中,Vobs代表观测的结果,Vmodel为模式的结果,Vmodel表示所有样本的模式平均值,Vobs代表所有观测样本的平均,i代表不同的样本,n为计算时的样本数。
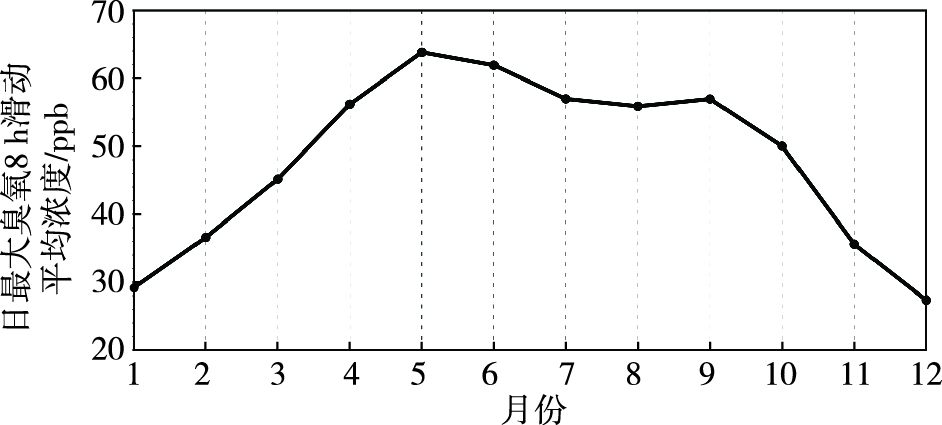
2 结果与讨论 2.1 长江三角洲臭氧污染的观测分析根据国控站的臭氧观测数据,首先对2014—2019年长江三角洲地区月平均MDA8臭氧浓度进行分析,如图 2所示。长江三角洲臭氧污染最严重的月份是5月,其次为6月,5月和6月MDA8臭氧浓度分别为63.8 ppb和62.0 ppb。长江三角洲地区污染最严重的月份与华北地区有所区别,华北地区臭氧污染最严重的月份通常为6—7月[38]。相对于6—7月,长江三角洲5月臭氧污染更为严重的原因之一在于长江三角洲地区雨季(梅雨)主要发生在6—7月,降水偏多不利于臭氧生成,使得臭氧污染低于5月[39-40]。4月和7—9月,臭氧污染状况相近,MDA8臭氧浓度在55.0~57.0 ppb。臭氧浓度最低的月份为12月,次低月份为1月,长江三角洲地区的MDA8臭氧浓度在12月可低至27.3 ppb。
|
图 2 2014—2019年长江三角洲地区月平均MDA8臭氧浓度 Fig.2 Monthly average MDA8 ozone concentration in the Yangtze River Delta region from 2014 to 2019 |
图 3分析了2014—2019年长江三角洲地区不同季节的MDA8臭氧浓度和变化趋势。2014—2019年(2017年除外),长江三角洲地区在夏季(6—8月)臭氧污染最严重,其次为春季(3—5月),污染最轻为冬季(12月—次年2月),MDA8臭氧浓度在春、夏、秋、冬4个季节的平均值分别为55.1 ppb、58.3 ppb、47.5 ppb和30.7 ppb。与此同时,2014—2019年长江三角洲的臭氧污染在不同季节也呈现加重的态势,这与中国大城市近些年臭氧污染趋势一致,这种趋势与人为源排放和气象条件都有关系[10]。春季,长江三角洲臭氧污染上升的趋势最明显,MDA8臭氧浓度的线性趋势为2.7 ppb ·a-1。夏季,长江三角洲地区MDA8臭氧浓度的上升趋势也达到2.3 ppb ·a-1。秋季和冬季,臭氧的上升趋势比较弱,分别为1.6 ppb ·a-1和1.2 ppb ·a-1。其中,春季臭氧浓度增加趋势大于其他季节,主要在于春季浓度在前些年(如2014—2016年)较低,但近年来浓度增加较快,甚至平均浓度与夏季相当(如2017年和2018年),部分原因可能来自NO减排及其导致的滴定作用削弱[17, 26, 35],具体控制机制有待未来研究进一步厘清。

|
图 3 2014—2019年长江三角洲地区各个季节MDA8臭氧浓度年变化 Fig.3 Annual variation of seasonal MDA8 ozone concentration in the Yangtze River Delta region from 2014 to 2019 |
为进一步分析长江三角洲及附近省市臭氧污染的空间分布,图 4展示了2014—2019年各个季节MDA8臭氧浓度的变化特征。长江三角洲地区臭氧污染最严重的季节(夏季),约有一半的格点MDA8臭氧季节平均浓度超过60 ppb。长江三角洲地区的污染比河南省和山东省略低5 ppb,比西南侧的江西省和福建省要高5~10 ppb(图 4b)。春季(图 4a),长江三角洲地区和其西北侧的山东省和河南省污染程度相当,比南侧的省份要略高5 ppb左右。但是,长江三角洲地区和周围省份在秋季和冬季MDA8臭氧浓度分布比较平均,臭氧污染相差不大(图 4c—d)。因此,春季和夏季,不同省市臭氧污染差距比较大,秋季和冬季的污染分布相对均匀。

|
图 4 2014—2019年各季节长江三角洲地区MDA8臭氧浓度(色阶)空间分布(a.春季,b.夏季,c.秋季,d.冬季;蓝色框代表长江三角洲地区) Fig.4 Spatial distribution of seasonal average MDA8 ozone concentration (color scale) in the Yangtze River Delta region (blue box) from 2014 to 2019 (a. spring, b. summer, c. autumn, d. winter) |
为定量分析长江三角洲地区不同年份的高臭氧污染情况,依据GB3095—2012《环境空气质量标准》中臭氧污染二级标准(MDA8臭氧浓度大于等于160 μg ·m-3,即在298 K、一个标准大气压下,大于等于82 ppb),计算了2014—2019年长江三角洲地区每年超过二级标准的天数。长江三角洲地区臭氧污染最严重的年份为2019年,其次为2017年,各有32 d和26 d超过臭氧污染二级标准。在其余的4 a中,一共有33 d臭氧污染超过二级标准。2014—2019年,5月和6月各有23 d和22 d臭氧污染超过二级标准,1—3月和10—12月,长江三角洲地区没有发生臭氧污染超过二级标准的情况。因此,臭氧污染超标主要集中在4—9月。
此外,世界卫生组织(World Health Organization,WHO)在2021年提出新的臭氧暖季峰值的标准[41]:对MDA8臭氧浓度进行6个月滑动平均后,其最大值小于60.0 μg ·m-3(31.0 ppb)。根据最新标准,长江三角洲地区2014—2019年的暖季峰值为58.7 ppb,峰值中心位于7月8日,比WHO提出的标准高接近1倍,未来暖季的臭氧污染需要进一步关注和控制。
2.2 模式结果评估和验证本研究对2014—2019年全年长江三角洲地区的MDA8臭氧浓度的模拟与观测结果进行评估,如图 5所示。由于现阶段中国没有提出相关标准,采用美国国家环境保护局提出的平均分数偏差(MFB)和平均分数误差(MFE)标准:VMFE < 35%, -15%≤VMFB≤15%[42]。模式在2014年的MFB为20%,比基准偏高5%,其他年份模拟的MFB和MFE都满足评估标准,模拟较好再现长江三角洲地区的臭氧浓度变化。

|
图 5 长江三角洲地区MDA8臭氧浓度观测和CMAQ模式模拟的对比 Fig.5 Comparison of MDA8 ozone concentration in the Yangtze River Delta region between observations and CMAQ simulation |
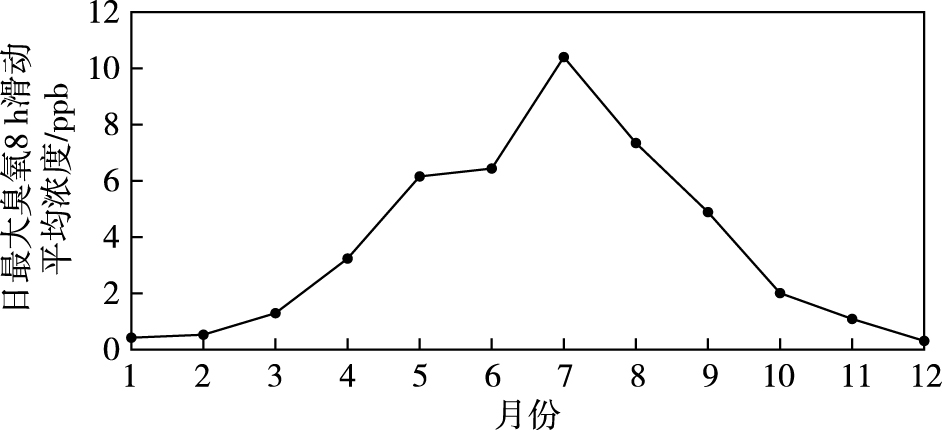
依据敏感性实验的结果(见1.2节模式情景介绍),分析2014—2019年不同月份长江三角洲地区天然源排放对臭氧污染的贡献(图 6)。天然源对臭氧生成贡献最高的月份与长江三角洲地区臭氧污染最严重的月份(5月和6月,图 2)有所区别,长江三角洲地区天然源排放生成臭氧最多的月份为7月,MDA8臭氧浓度为10.4 ppb,这可能与高温、强烈的光照和茂盛的植物生长都有关系[43]。其次为8月和6月,此时天然源排放贡献的MDA8臭氧浓度分别为7.3 ppb和6.4 ppb,天然源排放贡献最高的3个月份都在夏季。天然源对臭氧贡献最低的3个月份都位于冬季(12月—次年2月),在这3个月天然源排放贡献得臭氧不超过0.5 ppb。
|
图 6 2014—2019年长江三角洲地区天然源贡献的月平均MDA8臭氧浓度 Fig.6 Monthly average MDA8 ozone concentration from biogenic emissions in the Yangtze River Delta region from 2014 to 2019 |
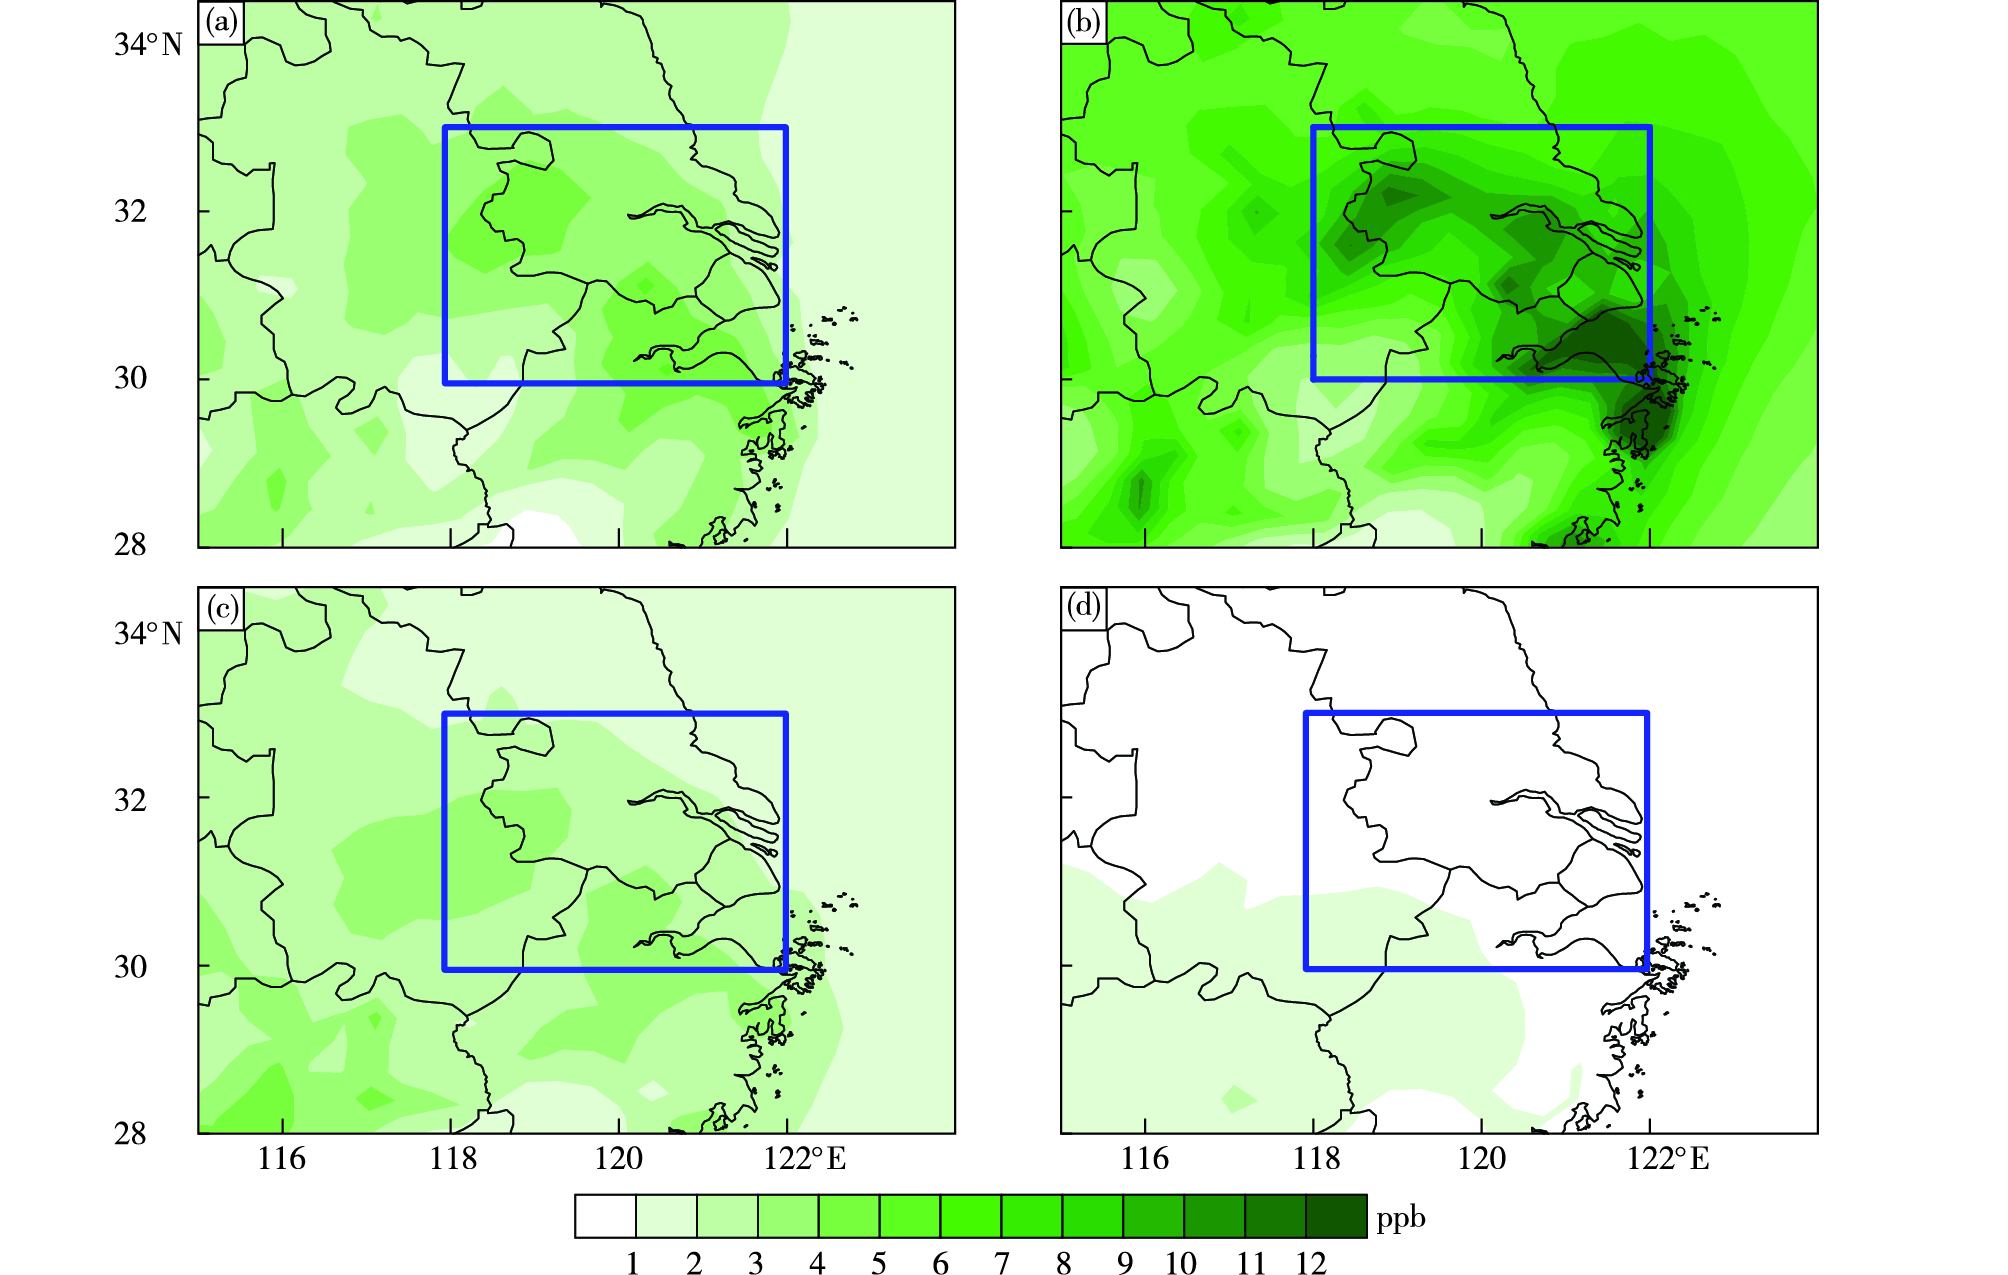
2014—2019年各季节天然源排放对长江三角洲地区臭氧贡献的空间分布如图 7所示。长江三角洲地区天然源贡献最高的是夏季(图 7b),约有1/3的格点MDA8臭氧浓度超过10 ppb,天然源排放贡献最多的地区主要位于江苏省南部、上海市和浙江省东北部,这与WANG et al.[44]和LIU et al.[45]的研究一致。相比而言,长江三角洲周围地区由天然源排放贡献的MDA8臭氧浓度总体为5~6 ppb。春季和秋季,长江三角洲地区天然源贡献的臭氧相差不多(图 7a、c),春季为3~4 ppb,秋季为2~3 ppb。与夏季相比,春季和秋季天然源的分布比较均匀。冬季,长江三角洲由天然源排放贡献的MDA8臭氧浓度最低(图 7d)。
|
图 7 2014—2019年各季节长江三角洲地区天然源贡献的MDA8臭氧浓度(色阶)空间分布(a.春季,b.夏季,c.秋季,d.冬季;蓝色框代表长江三角洲地区) Fig.7 Spatial distribution of seasonal average MDA8 ozone concentration (color scale) from biogenic emissions in the Yangtze River Delta region (blue box) from 2014 to 2019 (a. spring, b. summer, c. autumn, d. winter) |
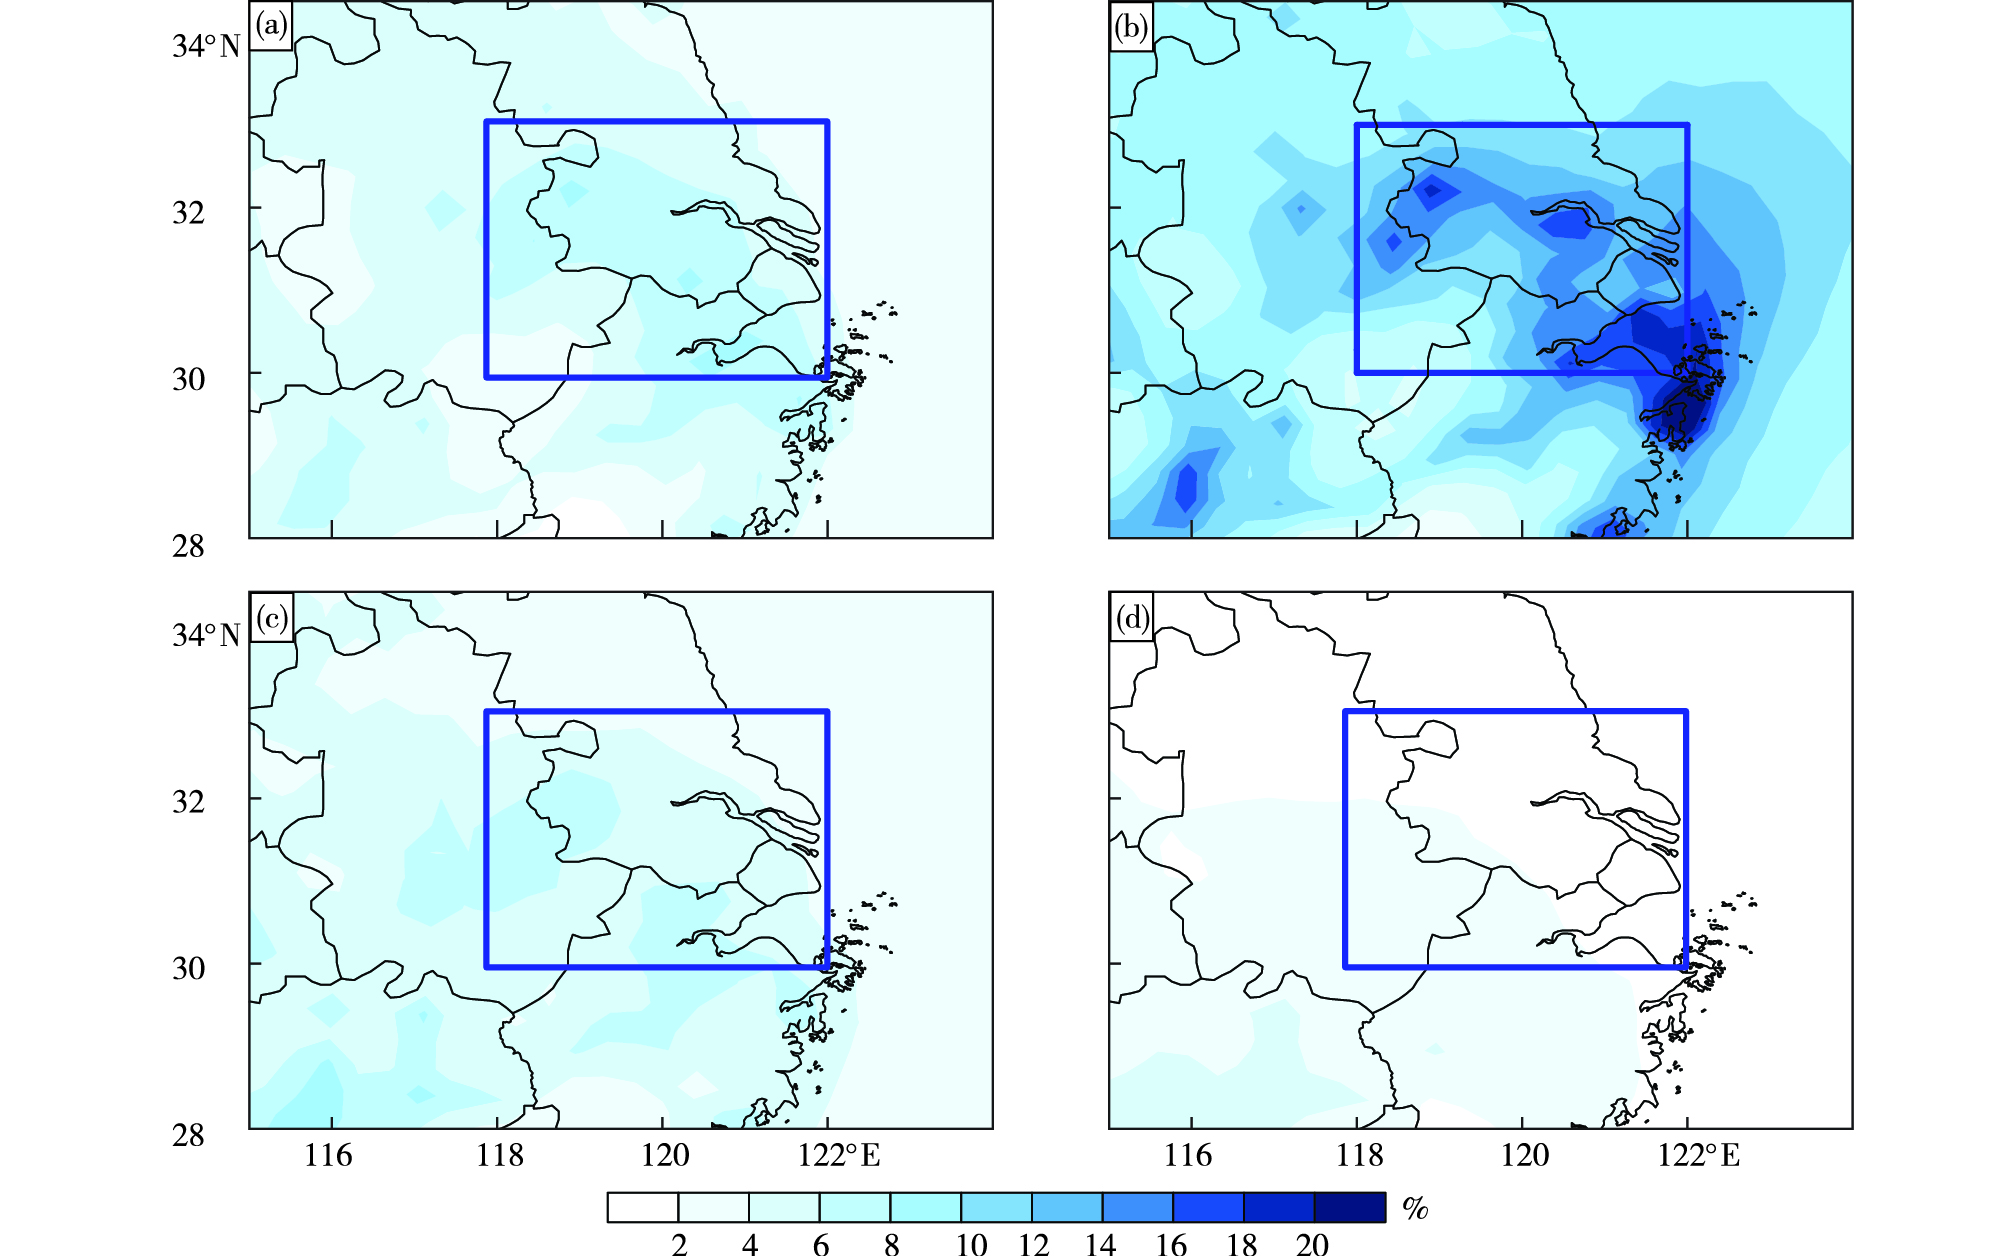
图 8展示了WRF-CMAQ模式模拟中天然源排放贡献的臭氧在总臭氧生成(对照组的臭氧浓度)中所占的比例。夏季,长江三角洲天然源贡献得最多(图 7b),同时天然源所占的比例也最大(图 8b)。在浙江省东北部,天然源贡献的臭氧生成比例可以占到20%,长江三角洲整个区域的平均比例也接近12%。春季,长江三角洲由天然源排放贡献的臭氧约为6%,长江三角洲周边地区天然源贡献臭氧的比例更低,约为4%(图 8a)。而冬季,长江三角洲天然源对总臭氧的贡献最少(图 8d)。
|
图 8 2014—2019年各季节长江三角洲地区天然源贡献的臭氧占总生成臭氧的比例(色阶;a.春季,b.夏季,c.秋季,d.冬季;蓝色框代表长江三角洲地区) Fig.8 Proportion (color scale) of seasonal MDA8 ozone contributed by biogenic emissions to total ozone production in Yangtze River Delta region (blue box) from 2014 to 2019 (a. spring, b. summer, c. autumn, d. winter) |
为了进一步厘清天然源排放对臭氧重污染的贡献,图 9展示了2014—2019年各季节长江三角洲地区MDA8臭氧浓度高于臭氧污染二级标准(82.0 ppb)时,天然源排放对臭氧浓度的贡献以及所占的比例。在长江三角洲地区MDA8臭氧浓度高于82.0 ppb时,天然源贡献的MDA8臭氧浓度为9.9 ppb(图 9a),并且天然源的贡献要比夏季平均值(8.0 ppb,图 7b)高。其主要原因在于高臭氧污染时,高温、强地面太阳辐射导致天然源增加,从而对臭氧的影响增加,GAO et al.[17]前期的研究也发现了类似现象。在MDA8臭氧浓度超过82.0 ppb时,长江三角洲地区天然源贡献的臭氧最高占比大约为15%,其主体位于浙江省东北部和江苏省南部。

|
图 9 2014—2019年各季节长江三角洲地区MDA8臭氧浓度高于臭氧污染二级标准(82.0 ppb)时天然源贡献的臭氧浓度(a,色阶)及其占总臭氧生成比例(b,色阶)的空间分布 Fig.9 Spatial distribution of ozone concentration (a, color scale) from biogenic emissions and proportion (b, color scale) of it to total ozone production when MDA8 ozone concentration is higher than 82 ppb in the Yangtze River Delta region from 2014 to 2019 |
通过国控站2014—2019年的观测资料,研究了长江三角洲地区不同季节的臭氧污染时空分布特征,利用WRF-CMAQ模式定量分析了各个季节天然源排放对臭氧污染的贡献。长江三角洲臭氧污染最严重的季节为夏季,臭氧污染最严重的月份却为5月(春季)。2014—2019年的春季和夏季,长江三角洲MDA8臭氧浓度都呈现出明显的上升趋势,分别达到2.7 ppb ·a-1和2.3 ppb ·a-1。在未来的研究中,长江三角洲春季的污染需要得到更多关注。
天然源贡献最多的季节为夏季,MDA8臭氧浓度为8.0 ppb,其中7月MDA8臭氧月平均浓度为10.4 ppb。在浙江省东北部,天然源贡献的臭氧可占总臭氧的20%。当长江三角洲臭氧污染超过二级标准时,天然源贡献的MDA8臭氧浓度为9.9 ppb,比夏季平均值高。此外,春季和秋季天然源贡献的MDA8臭氧浓度也不容忽略,为2.0~4.0 ppb。在未来人为源减排的大背景下,天然源对臭氧生成的作用可能会进一步凸显,因此,今后有必要开展更多天然源对臭氧污染影响的研究。
| [1] |
United Nations Environment Programme EEAP. Environmental effects of ozone depletion and its interactions with climate change: progress report, 2015[J]. Photochem Photobiol Sci, 2016, 15(2): 141-174. DOI:10.1039/c6pp90004f |
| [2] |
EMBERSON L D, BVKER P, ASHMORE M R, et al. A comparison of North American and Asian exposure-response data for ozone effects on crop yields[J]. Atmos Environ, 2009, 43(12): 1945-1953. DOI:10.1016/j.atmosenv.2009.01.005 |
| [3] |
FENG Z Z, SUN J S, WAN W X, et al. Evidence of widespread ozone-induced visible injury on plants in Beijing, China[J]. Environ Pollut, 2014, 193: 296-301. DOI:10.1016/j.envpol.2014.06.004 |
| [4] |
WANG X K, ZHANG Q Q, ZHENG F X, et al. Effects of elevated O3 concentration on winter wheat and rice yields in the Yangtze River Delta, China[J]. Environ Pollut, 2012, 171: 118-125. DOI:10.1016/j.envpol.2012.07.028 |
| [5] |
BHATIA A, TOMER R, KUMAR V, et al. Impact of tropospheric ozone on crop growth and productivity: a review[J]. J Sci Ind Res, 2012, 71(2): 97-112. |
| [6] |
SILD E, PLEIJEL H, SELLDÉN G. Elevated ozone (O3) alters carbohydrate metabolism during grain filling in wheat (Triticum aestivum L.)[J]. Agric Ecosyst Environ, 2002, 92(1): 71-81. DOI:10.1016/S0167-8809(01)00270-5 |
| [7] |
樊丹丹, 屈文军, 高山红. 2016年12月青岛一次持续重污染天气的观测分析与数值模拟[J]. 海洋气象学报, 2020, 40(2): 71-82. |
| [8] |
吴进, 马志强, 熊亚军, 等. 北京地区供暖季两次重污染过程气象条件对比[J]. 海洋气象学报, 2019, 39(1): 38-45. |
| [9] |
吴炜, 丛春华, 郑怡. 山东气溶胶光学厚度时空分布及其与地面大气污染物质量浓度的相关性分析[J]. 海洋气象学报, 2021, 41(1): 58-67. |
| [10] |
LI K, JACOB D J, LIAO H, et al. Anthropogenic drivers of 2013-2017 trends in summer surface ozone in China[J]. Proc Natl Acad Sci USA, 2019, 116(2): 422-427. DOI:10.1073/pnas.1812168116 |
| [11] |
CHANG L Y, XU J M, TIE X X, et al. The impact of climate change on the western Pacific subtropical high and the related ozone pollution in Shanghai, China[J]. Sci Rep, 2019, 9(1): 16998. DOI:10.1038/s41598-019-53103-7 |
| [12] |
ATKINSON R. Atmospheric chemistry of VOCs and NOx[J]. Atmos Environ, 2000, 34(12/13/14): 2063-2101. |
| [13] |
WANG R N, TIE X X, LI G H, et al. Effect of ship emissions on O3 in the Yangtze River Delta region of China: analysis of WRF-Chem modeling[J]. Sci Total Environ, 2019, 683: 360-370. DOI:10.1016/j.scitotenv.2019.04.240 |
| [14] |
LI N, HE Q Y, GREENBERG J, et al. Impacts of biogenic and anthropogenic emissions on summertime ozone formation in the Guanzhong Basin, China[J]. Atmos Chem Phys, 2018, 18(10): 7489-7507. DOI:10.5194/acp-18-7489-2018 |
| [15] |
GENG F, TIE X X, GUENTHER A, et al. Effect of isoprene emissions from major forests on ozone formation in the city of Shanghai, China[J]. Atmos Chem Phys, 2011, 11(20): 10449-10459. DOI:10.5194/acp-11-10449-2011 |
| [16] |
WANG Q G, HAN Z W, WANG T J, et al. Impacts of biogenic emissions of VOC and NOx on tropospheric ozone during summertime in eastern China[J]. Sci Total Environ, 2008, 395(1): 41-49. DOI:10.1016/j.scitotenv.2008.01.059 |
| [17] |
GAO Y, YAN F F, MA M C, et al. Unveiling the dipole synergic effect of biogenic and anthropogenic emissions on ozone concentrations[J]. Sci Total Environ, 2021, 814: 151722. |
| [18] |
MA M C, GAO Y, WANG Y H, et al. Substantial ozone enhancement over the North China Plain from increased biogenic emissions due to heat waves and land cover in summer 2017[J]. Atmos Chem Phys, 2019, 19(1): 12195-12207. |
| [19] |
LUN X X, LIN Y, CHAI F H, et al. Reviews of emission of biogenic volatile organic compounds (BVOCs) in Asia[J]. J Environ Sci, 2020, 95: 266-277. DOI:10.1016/j.jes.2020.04.043 |
| [20] |
ZHANG Y Z, WANG Y H. Climate-driven ground-level ozone extreme in the fall over the Southeast United States[J]. Proc Natl Acad Sci, 2016, 113(36): 10025-10030. DOI:10.1073/pnas.1602563113 |
| [21] |
GUENTHER A B, JIANG X, HEALD C L, et al. The Model of Emissions of Gases and Aerosols from Nature version 2.1 (MEGAN2.1): an extended and updated framework for modeling biogenic emissions[J]. Geosci Model Dev, 2012, 5(6): 1471-1492. DOI:10.5194/gmd-5-1471-2012 |
| [22] |
REN Y, QU Z L, DU Y Y, et al. Air quality and health effects of biogenic volatile organic compounds emissions from urban green spaces and the mitigation strategies[J]. Environ Pollut, 2017, 230: 849-861. DOI:10.1016/j.envpol.2017.06.049 |
| [23] |
GAO Y, FU J S, DRAKE J B, et al. The impact of emission and climate change on ozone in the United States under representative concentration pathways (RCPs)[J]. Atmos Chem Phys, 2013, 13(18): 9607-9621. DOI:10.5194/acp-13-9607-2013 |
| [24] |
HAN H, LIU J, SHU L, et al. Local and synoptic meteorological influences on daily variability in summertime surface ozone in eastern China[J]. Atmos Chem Phys, 2020, 20(1): 203-222. DOI:10.5194/acp-20-203-2020 |
| [25] |
PU X, WANG T J, HUANG X, et al. Enhanced surface ozone during the heat wave of 2013 in Yangtze River Delta region, China[J]. Sci Total Environ, 2017, 603/604: 807-816. DOI:10.1016/j.scitotenv.2017.03.056 |
| [26] |
ZENG X R, GAO Y, WANG Y H, et al. Characterizing the distinct modulation of future emissions on summer ozone concentrations between urban and rural areas over China[J]. Sci Total Environ, 2022, 820: 153324. DOI:10.1016/j.scitotenv.2022.153324 |
| [27] |
MORRISON H, THOMPSON G, TATARSKⅡ V. Impact of cloud microphysics on the development of trailing stratiform precipitation in a simulated squall line: comparison of one- and two-moment schemes[J]. Mon Wea Rev, 2009, 137(3): 991-1007. DOI:10.1175/2008MWR2556.1 |
| [28] |
HONG S Y, NOH Y, DUDHIA J. A new vertical diffusion package with an explicit treatment of entrainment processes[J]. Mon Wea Rev, 2006, 134(9): 2318-2341. DOI:10.1175/MWR3199.1 |
| [29] |
GRELL G A, FREITAS S R. A scale and aerosol aware stochastic convective parameterization for weather and air quality modeling[J]. Atmos Chem Phys, 2014, 14(10): 5233-5250. DOI:10.5194/acp-14-5233-2014 |
| [30] |
IACONO M J, DELAMERE J S, MLAWER E J, et al. Radiative forcing by long-lived greenhouse gases: calculations with the AER radiative transfer models[J]. J Geophys Res: Atmos, 2008, 113(D13): D13103. DOI:10.1029/2008JD009944 |
| [31] |
MORCRETTE J J, BARKER H W, COLE J N S, et al. Impact of a new radiation package, McRad, in the ECMWF Integrated Forecasting System[J]. Mon Wea Rev, 2008, 136(12): 4773-4798. DOI:10.1175/2008MWR2363.1 |
| [32] |
SAHA S, MOORTHI S, WU X R, et al. The NCEP Climate Forecast System Version 2[J]. J Climate, 2014, 27(6): 2185-2208. DOI:10.1175/JCLI-D-12-00823.1 |
| [33] |
APPEL K W, BASH J O, FAHEY K M, et al. The Community Multiscale Air Quality (CMAQ) model versions 5.3 and 5.3.1: system updates and evaluation[J]. Geosci Model Dev, 2021, 14(5): 2867-2897. DOI:10.5194/gmd-14-2867-2021 |
| [34] |
LUECKEN D J, YARWOOD G, HUTZELL W T. Multipollutant modeling of ozone, reactive nitrogen and HAPs across the continental US with CMAQ-CB6[J]. Atmos Environ, 2019, 201: 62-72. DOI:10.1016/j.atmosenv.2018.11.060 |
| [35] |
LI M, ZHANG Q, KUROKAWA J I, et al. MIX: a mosaic Asian anthropogenic emission inventory under the international collaboration framework of the MICS-Asia and HTAP[J]. Atmos Chem Phys, 2017, 17(2): 935-963. |
| [36] |
MA M C, GAO Y, DING A J, et al. Development and assessment of a high-resolution biogenic emission inventory from urban green spaces in China[J]. Environ Sci Technol, 2022, 56(1): 175-184. |
| [37] |
ZHANG J X, GAO Y, LUO K, et al. Impacts of compound extreme weather events on ozone in the present and future[J]. Atmos Chem Phys, 2018, 18(13): 9861-9877. |
| [38] |
LI K, JACOB D J, SHEN L, et al. Increases in surface ozone pollution in China from 2013 to 2019: anthropogenic and meteorological influences[J]. Atmos Chem Phys, 2020, 20(19): 11423-11433. |
| [39] |
DING Y H, LIANG P, LIU Y J, et al. Multiscale variability of Meiyu and its prediction: a new review[J]. J Geophys Res: Atmos, 2020, 125(7): e2019JD031496. |
| [40] |
ZHAO Z J, WANG Y X. Influence of the West Pacific subtropical high on surface ozone daily variability in summertime over eastern China[J]. Atmos Environ, 2017, 170: 197-204. |
| [41] |
World Health Organization. WHO global air quality guidelines: particulate matter (PM2.5 and PM10), ozone, nitrogen dioxide, sulfur dioxide and carbon monoxide[M]. Gevena: World Health Organization, 2021: 1-273.
|
| [42] |
U.S. Environmental Protection Agency. Guidance on the use of models and other analyses for demonstrating attainment of air quality goals for ozone, PM2.5, and regional haze[Z]. North Carolina: Research Triangle Park, 2007.
|
| [43] |
WU K, YANG X Y, CHEN D, et al. Estimation of biogenic VOC emissions and their corresponding impact on ozone and secondary organic aerosol formation in China[J]. Atmos Res, 2020, 231: 104656. |
| [44] |
WANG Y J, TAN X J, HUANG L, et al. The impact of biogenic emissions on ozone formation in the Yangtze River Delta region based on MEGANv3.1[J]. Air Qual Atmos Hlth, 2021, 14(5): 763-774. |
| [45] |
LIU Y, LI L, AN J Y, et al. Estimation of biogenic VOC emissions and its impact on ozone formation over the Yangtze River Delta region, China[J]. Atmos Environ, 2018, 186: 113-128. |
 2022, Vol. 42


